Showing posts with label GCFR. Show all posts

25 May 2010

EIX: Financial Gauge Analysis for the March 2010 Quarter

Edison International (NYSE: EIX) earned $0.72 per share on a GAAP basis in 2010's first quarter, which ended on 31 March 2010.  Reported earnings were $0.04 less per share than the $0.76 Edison made in the same quarter of 2009.  Excluding special items, Edison's "Core" earnings, a non-GAAP measure, rose from $0.79 to $0.82 per share.

In our earlier review of Edison's Income Statement, we compared the actual results to our "look-ahead" estimates

We have now updated the various financial metrics we use to analyze Cash Management, Growth, Profitability and Value.  This post reports on the metrics for Edison and the associated financial gauge scores.  The metrics were calculated using data from Edison's current and historical financial statements, including the latest 10-Q report.


Edison International owns Southern California Edison and Edison Mission Group.  SCE is a regulated utility that generates and acquires electricity and delivers it to customers in parts of Southern California.  Edison Mission Energy owns, or has interests in, various independent power-generation facilities.  Additional background information about Edison International and the business environment in which it is now operating can be found in the look-ahead.

In summary, Edison's latest quarterly results produced the following changes to the gauge scores:


The current and historical values for the financial metrics that determine the gauge scores are listed below, with some brief commentary.  Readers are encouraged to verify these figures and calculate others as they see fit using the filings available at the SEC's web site and elsewhere.


27 June 2009

Documenting Changes to Our Gauges

During the two-year-plus life of this blog -- this is post #499 -- we have made frequent small adjustments to our gauges of corporate financial performance and value.  It isn't unusual for us to tinker with some factor multiple times until we get comfortable with it.

The following are the types of changes that we have made (and are likely to make again):
  • Add or delete a financial metric from a category gauge
  • Alter the relative weights of the various metrics used to compute one of the category gauge scores
  • Alter the relative weights of the category gauges when determining the Overall Gauge score.

The changes have been intended to make our analyses more accurate, complete, and insightful and, if possible, make the gauges better indicators. 

The catalyst for a change might be a belated realization that we had not been giving some aspect of a company's finances sufficient attention.  Or, we might have discovered that a financial ratio we relied on produces misleading results under certain circumstances.  It might also be recognition that a certain factor provides a better or worse indication of future results that we had first thought.


Our second-quarter 2009 analyses will include an additional Growth metric: the annual growth in Operating Profit after Taxes, when averaged over 4 years.  We have long wanted to add a multi-year assessment of company growth, but we've found Net Income to be too much affected by non-operating items as well non-recurring operating items.

We will also start, as part of an experiment, to compare Price/Earnings ratios to this Operating Profit growth rate to create a (better, we hope) variant of the well-known PEG ratio.

Although we've tried, we haven't done a good job at communicating these changes to readers.  We resolve to do better.  Too often, we have simply referred to "algorithm tweaks" to explain scoring changes.

As a first step, we have revised the descriptions of the GCFR dashboard and the Cash Management, Growth, Profitability, Value, and Overall gauges.  These posts were some of the first items published on this blog, and they had not been kept up with the changes we had made since.

01 October 2008

NT: All About Nortel

We thank Mark Evans at the All About Nortel web site for his complimentary reference to our recent look ahead to Nortel's third-quarter results. Mark's post triggered some interesting comments.

07 September 2008

Financial Alchemist Article on Valuation Ratios and Cash

A recent post by the Financial Alchemist explained why adjusting a company's Price/Earnings multiple to exclude Cash can produce misleading results if it is not accompanied by an adjustment to Earnings.

Turley Muller's excellent blog is one of our favorites.

His point is that Cash contributes Interest Income to Earnings; therefore, it is erroneous to exclude the Cash without excluding the Interest.  Turley explains this well, and he provides examples.

The amount of Cash and and Cash Equivalents a company has can be found in the Current Assets section of its Balance Sheet.  Interest income is generally shown as a non-operating gain on a company's Income Statement.

Why would investors subtract Cash/Share from the Price/Share?  Cash is required for liquidity, but a growing company's other Assets should produce the lion's share of future cash flows, earnings, and dividends.  When cash flows are expected to increase at a rate significantly higher than the interest earned on Cash, the component of the Price/Share that reflects Cash on hand deserves a lower multiple than the other components.

By subtracting Cash/Share, these investors are trying to remove the effect of the low-earning Cash on the P/E multiple.  Since some companies have Cash well in excess of normal needs, excluding Cash might enable fairer comparisons across companies.

It's debatable that the company's Cash level is a separable component of its share price.  It might be most true if investors have a reason to believe the company will rid themselves of excess cash with a dividend to shareholders.  Microsoft Corp. (MSFT) has done this, but it is relatively rare.

In any event, Turley's point is valid.  If you're going exclude Cash from the share price, you should also subtract the associated interest income.

At GCFR, we don't make the adjustments discussed above.  However, when we calculate Enterprise Value, we adjust Market Value for both Cash and Debt.  We then determine the Enterprise Value to Cash Flow from Operations ratio.  If company-reported CFO figures include Interest Income and Expense, we should consider removing them.  However, it's probably a minor consideration as we compare EV/CFO ratios not across companies but over time at individual companies.  We're more interested in discovering whether a company's Enterprise Value is increasing faster or slower than Cash Flow, when judged by historical norms at the company.

27 August 2008

Reader Feedback Requested

GCFR is looking for feedback from readers.  Do you prefer information that explains the organization of financial statements, analytical approaches to assess these statements, evaluations of actual quarterly reports, or extrapolated "look-aheads" to future earnings? 

All of the above?  None of the above?

Readers are asked to visit the GCFR web site and vote.  The poll will remain open through September. 

Feel free to leave a comment on web page or email us if you wish to provide more specific comments.

04 February 2008

Link Fixed

Our post looking ahead to Cisco's quarterly report was very popular. The number of people visiting the GCFR site on Monday was more than 4 times the daily average. The count was boosted by a link to the post prominently, but temporarily, placed on the Google Finance quote page for CSCO.

One reader took the time to point out a broken link in the Current Gauge Readings section on the web site's right margin. We fixed it. Thanks.

We anticipate that our next post will analyze BP p.l.c's (BP) report for the quarter that ended on 31 December 2007.

28 January 2008

Some Unexpected Attention

In yesterday's post dealing with the footnotes to Microsoft's 10-Q, we mentioned our surprise at learning the extent to which Microsoft and Alcatel-Lucent are entangled in legal disputes alleging patent infringement claims.

This single reference in a 16-paragraph article resulted in the post being listed temporarily in the Blog Posts section of Google Finance's page for Alcatel-Lucent. Fifteen readers clicked to read the full article.

We don't know why Google chose to give one of our analyses a few hours of extra visibility or why an article that repeatedly cited Microsoft would end up on an Alcatel-Lucent page. Nevertheless, we are grateful for the attention and hope some of the new readers will find our pages interesting and worthy of regular visits.

26 January 2008

A Small Cash Management Scoring Change Involving Debt and Cash Flow

In May 2007, we added the following three metrics to the set that determine the Cash Management gauge score:
In this post, we are going to discuss the second metric: Debt/CFO, which is expressed in years. For example, a company may have short- and long-term debt that equals 2.5 years of Cash Flow from Operations. Higher durations indicate greater leverage in the company's capital structure, giving a different perspective than the more common LTD/Equity ratio (which we also consider). In a healthy company, debt payments are typically made out of future cash flows. If the cash flow isn't sufficient, the company might have to take on more debt (probably on more onerous terms) or sell otherwise productive assets.

For computing the Cash Management gauge score, our approach had been to give points for year-to-year reductions in the Debt/CFO ratio. This approach inadvertently penalized companies have little or no debt. If the debt level is low (e.g., one year of Cash Flow), then there is no need to be concerned with whether the level is static or declining.

Therefore, we have altered the scoring to reward low Debt/CFO ratios. We will still give credit for debt reductions, but it won't be the entire focus of the score.

The new scoring will be put into effect immediately. Previous scores will recalculated as they are needed for new analyses. The effects are not expected to be significant for most companies.

23 June 2007

Neural Net

We're thrilled that GCFR might have inspired some ideas for a neural net model based on fundamental analysis. We'll be monitoring the progress on Neural Market Trends, which is a site we like. Incidentally, the author mentions that Tidewater, a company that has had high GCFR scores, came out near the top of their "super duper small cap value scan."

BloggerJacks
provides an interesting response to a Reuters article we cited about quantitative analysis on the upswing relative to traditional equity analysis.

16 June 2007

Another Tweak to the Gauge Scoring

The interlude between first and second quarter earnings reports has afforded us an opportunity to try out some improvements to the financial gauges. First, we expanded the Cash Management Gauge to include three additional metrics. Then, we adjusted the weights assigned to each metric that is an input to one gauge or another.

Today, we're announcing that the PEG ratio contribution to the Value Gauge has been replaced with Enterprise Value (EV)/Cash Flow from Operations (CFO, or OCF).

The P/E to earnings Growth (PEG) can be a very important ratio. Many analysts will say that shares of a company are inexpensive when the P/E is less than the earnings growth rate in percent; i.e, when the PEG is less than 1.0. By this reckoning, a company growing its earnings at an annual rate of 20 percent would be a good value when the P/E is below 20. Conversely, shares are deemed wildly expensive when the PEG exceeds, say, 2.0.

The growth rate in the PEG should be the percent increase expected in next year's earnings relative to the current year. This is called forward earnings growth, in contrast with backward-looking trailings earnings growth. Alas, forward earnings growth predictions are very subjective. We sought to avoid this problem by using the trailing earnings growth to calculate PEG; however, this hasn't worked out very well. Too often, we've seen negative correlations between our PEG score and future stock price moves. So, we decided to nix the PEG for something else.

EV/CFO

Despite its arcane name, Enterprise Value / CFO has similarities to the basic P/E ratio with which readers are well acquainted. The "P" in P/E represents the company's market value; i.e., what the price would be to buy every share outstanding. However, the real world is more complicated: the purchaser also has to deal with the company's debt. The EV better reflects the cost to the purchaser. It adds debt (long- and short-term) to the market value, but subtracts the company's cash and short-term investments (which could pay down the debt or offset the cost of the share purchase).

The "E" in P/E obviously represents earnings, and CFO is just another measure of how much money the company is bring in from its core business. Some say that CFO is harder to manipulate than income; we're not sure whether that is true, but cash does have the benefit of being a tangible asset. Our frequent readers know that we use the Accrual Ratio in the Profitability Gauge to distinguish earnings due to cash flow from earnings due to Balance Sheet changes.

For each 5 percent a company's EV/CFO is below its average over the previous four years, it will get one point in our scoring system, with a maximum of five points.

We'll see how well all these adjustments work out when we're analyzing the impending flood of second quarter reports. The beneficial changes will be retained, and the others will be modified discarded. We don't expect to ever stop searching for improvements. While the adjustments change scores that were published previously,we will always use a consistent basis when comparing new scores to old.

15 June 2007

It's Nice to be Noticed

GCFR is listed as a resource on the Mad Money and Fast Money Fan Site. This site provides summaries of the CNBC shows "Mad Money" and "Fast Money."

We were also mentioned kindly on The Kirk Report, one of the more highly regarded stock market web sites.

10 June 2007

Weighting Changes

We have tinkered with the relative weights assigned to the financial ratios and metrics that are used to calculate the gauge scores. We have also adjusted how much each individual gauge score is weighted to compute the Overall Gauge score.

Company-specific scores will be recalculated with the new weights the next time the company is analyzed.

These adjustments were made in a quixotic effort to improve the correlation between the Overall Gauge score and future stock price gains. The selection of weights is as much art as science. We typically take a fresh look at the weights when the set of metrics used for a particular gauge are revised, as we recently did on a trial basis for the Cash Management gauge.

We should probably consider weights that vary by industry, since it seems clear that some parameters are more relevant to some industries than others. We could also consider weights that vary with market capitalization, growth vs. value, etc.

We also make occasional revisions to the equations that convert the ratios listed below into point scores.


Cash Management (20%, was 15%)
Previous Weight
Current Weight
10
5
10
10
40
20
30
17.5
10
5
N/A
10
N/A
10
N/A
22.5


Growth (10%, was 15%)


10
10
40
40
20
20
30
30


Profitability (30%, was 25%)


20
25
20
10
25
40
35
25


Value (40%, was 45%)


10
10
40
30
25
40
25
20


A few additional comments. We increased the weight of the Cash Management score because three new parameters make it a more robust indicator of corporate health. We trimmed the weight of the Growth gauge because it hasn't correlated well with future stock price performance, which we find counter-intuitive. Perhaps sales and earnings growth are so widely analyzed that they get reflected in stock prices immediately, losing any predictive power they might have had. Or, perhaps the growth metrics we track are reflecting growth by acquisition, which often disappoint, rather than the growth by innovation.

28 May 2007

Enhancing the Cash Management Gauge

We have used the following five ratios, mostly derived from the Balance Sheet, to calculate the Cash Management Gauge:
The two ratios involving Inventory are overweighted, relative to the other three figures, such that Inventory influences half of the Cash Management gauge score. The overweighting reflects our belief that Inventory data can reveal much about current and future business conditions at manufacturing companies and how deftly corporate managers are handling these conditions. Manufacturers buy raw materials, fabricate or assemble these items, and output finished goods for sale. The various components of Inventory give us insight into each step.

A microsecond of further thought suggests that services such as financing, marketing, and transportation are also important. Banks, advertising firms, and shippers have, to name three, long provided services to manufacturers and other companies. Today, work that manufacturers traditionally performed in house, such as design or payroll processing, is being contracted out to specialty service firms.

Service firms, such ADP (IT services) and TDW (marine services), might have capital equipment in abundance, but they don't have Inventory in the same sense as manufacturers. The notion of Inventory also differs when we consider retailers (all inventory is product ready for sale), energy companies (inventory value varies with commodity prices), electric utilities (the final product is hard to store), and software companies (the raw material is intellectual property).

It should be clear from the preceding that an inventory-weighted Cash Management gauge is less applicable, to one extent or another, to service companies than manufacturers. Not surprisingly, we've seen the gauge behave erratically when evaluating service companies.

In an attempt to address this problem, we have identified three additional cash management ratios as candidates to broaden the gauge calculations. We will experiment with these parameters when analyzing second quarter financial statements. We will then evaluate each candidate to determine if it added to the analysis process or not.

The three candidate ratios are:

Working Capital / Market Capitalization. We learned about this ratio from the Motley Fool. Working Capital is Current assets minus Current Liabilities. Market Capitalization is Market Value + Debt. Market capitalization is, therefore, an approximation for the true cost to an acquirer. A greater percentage of working capital would presumably be attractive to the acquirer. For this reason, the ratio might also be considered for the Value Gauge.

Debt/CFO. The ratio indicates how many years of operating cash flow are required to pay off the company's short-term and long-term debt.

Cash Conversion Cycle (CCC) Time. This one is a little complicated, but it is well explained here. Short CCC times indicate that the company is using its working capital efficiently. The CCC time is the sum of days of inventory [Inventory/(CGS/day)] and days of sales outstanding [Receivables/(Revenues/day)], less days of purchases outstanding {Accounts payable / [(CGS+ increased inventory)/day)]}. Note that the first two terms show the company consuming working capital for inventory held and sales for which customers haven't yet paid. We subtract the working capital the company is "saving" by not yet paying for its own purchases.

In computing the Cash Management gauge score, we're going to give 1 point for each 2 percent reduction in the CCC time, each 2 percent reduction in Debt/CFO, and each 1 percent increase in Working Capital to Total capitalization. As we gain more experience with these ratios, it is likely that we will adjust the scoring.

We will weight our five original and three new ratios, relative to each other, as listed below:
  • Current ratio: 5
  • LTD/Equity: 10
  • Finished Goods/Inventory: 20
  • Receivables/Revenue: 17.5
  • Inventory/CGS: 5
  • Working Capital / Market Capitalization: 22.5
  • Debt/CFO: 10
  • Cash Conversion Cycle Time: 10
If a ratio doesn't apply to a particular company under analysis, the weight for that ratio will be zero.

11 April 2007

Value Blog Review

Earlier this week, the Value Blog Review made some nice remarks about our web site and methodology. We appreciate the comments.

08 April 2007

New Domain for This Site

If we can pull it off, this web site will move to http://www.financial-gauges.com in a few days.

23 November 2006

The Overall Gauge


We've separately discussed the four category gauges: Cash Management, Growth, Profitability, and Value.  Each gauge displays a score between 0 and 25.

The Overall Gauge score is a weighted average of the category gauge scores, with an adjustment made to scale the result to a range between 0 and 100 points.

The weights are listed below:
  • Cash Management: 20
  • Growth: 10
  • Profitability: 30
  • Value: 40


The Overall score is:

    = 4 * [(sum of (scores * weights)] / (sum of weights)


Because we are very stingy when awarding points, an Overall score, in general, above 50 is decent, 60 is very good, and 70 is excellent.  The highest scores we have observed have been in the low 80's.

We also consider a change in the Overall Gauge score to be significant.  While a 40-point score is, by itself, mediocre, we would deem a rise from, say, 20 to 40 points to be a favorable outcome.


In weighting the various metrics that drive each category gauge, and in weighting the category gauge scores to compute the Overall Gauge score, we have used heuristics to align the results with future share price appreciation.  The highest-weighted scores are those that have historically correlated reasonably well with 12-month share price growth for a variety of companies. 


We've seen some good correlation coefficients, as high as 0.8, for some companies, but the correlations are much weaker or even negative for other companies. 


In other words, our scores are meaningful for some companies and less so, or not at all, for others.  We urge readers to look beyond the rolled-up scores to the individual performance and value metrics and draw their own conclusions. 


This post was last modified on 27 June 2009.

04 November 2006

The Value Gauge

The Value gauge score depends on the current and past values for the following metrics:
The gauge value is determined by calculating a score for each of the five items listed above and described below.  A weighted average of the scores is scaled to set its minimum value at zero and its maximum value at 25 points.

Please note there is an overriding zero-point floor and a five-point ceiling for each score component.


Trailing Price/Earnings


A company's Price/Earnings ratio will fluctuate based on investors' assessment of its future prospects.  A sign investors may be undervaluing the company is a P/E at, or below, the low end of the historic range for that company.  Similarly, higher-than-normal P/E values might be an indication of excessive optimism among investors.

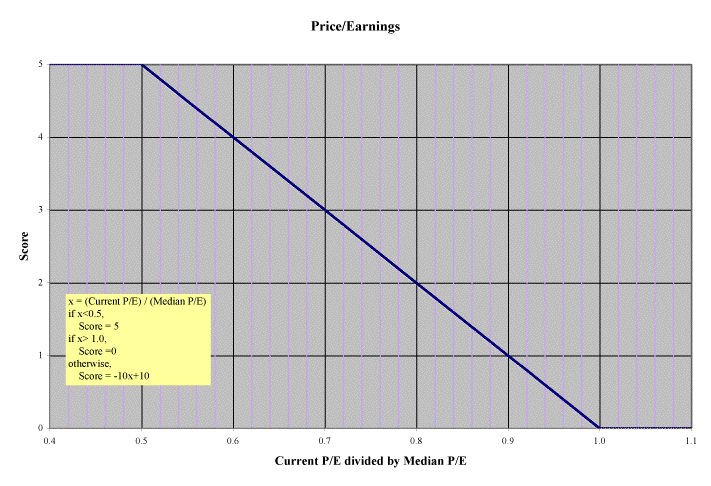
A company gets Trailing P/E value points when its current P/E ratio is less than its median value over the last 16 quarters.

Score = (-10) * [(P/E) / (Median P/E)] + 10

If the P/E is 50 percent of its median value, or less, the company gets 5 points.


Trailing Price/Earnings vs. S&P 500 P/E


Company-specific news, such as the success or failure of a new product, will understandably lead to swings in the company's Price/Earnings because it is clear that earnings will grow more or less robustly as a result.  However, changes that affect all companies in an industry or all companies that operate in a particular market can also significantly influence future earnings and, therefore, P/E ratios.

For example, rising interest rates tend to slow economic activity, reducing sales and profits, and also cut the present value of future earnings.

Comparing a company's P/E ratio to the P/E ratio of the overall market, as represented by the S&P 500 index, is one way to filter out the broader factors that affect valuations. When a company's P/E is, say, 10 percent higher the S&P P/E, the company's shares are said to trade at a 10 percent premium to the market.  Similarly, a company P/E that is only 90 percent of the market P/E represents a 10 percent discount.

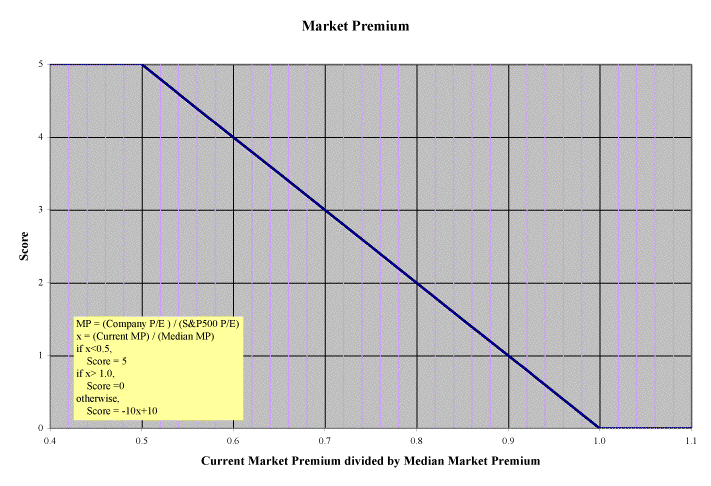
A lower-than-normal premium, or a greater-than-normal discount, could be indicative of an undervaluation.  We award value points when the ratio of the company's P/E to the market's P/E is less than its median value over the last 16 quarters.

Score = (-10) * [(Current P/E relative to S&P) / (Median P/E relative to S&P)] + 10

If a company's current P/E is 80 percent of the S&P 500's P/E (i.e., a 20 percent discount), but the median ratio is a 10 percent premium, then the score would be:

(-10) * [(0.8) / (1.1)] + 10 = 2.7 points

PEG
Many investors consider a low PEG, which indicates that the Price/Earnings is modest relative to earnings growth, to be an important sign of undervaluation. 

The PEG ratio is found by dividing the P/E ratio by the earnings growth rate in percent.  For example, the PEG would be 1.0 when the P/E is 12 and earnings are growing by 12 percent.

The PEG is especially useful if the denominator is the rate the company's earnings will grow in the future.  At GCFR, we're leery of projected earning growth rates, we don't assign any credibility to published five-year forward growth rates.

We've used to the trailing one-year earning growth rate in our PEG calculations, but we have been unsatisfied by the results.  One-time gains and losses make the PEG values erratic.

Instead, after much experimentation, we've settled on using the four-year average rate of growth in Operating Profit after Taxes as the earnings growth rate in the PEG calculations.

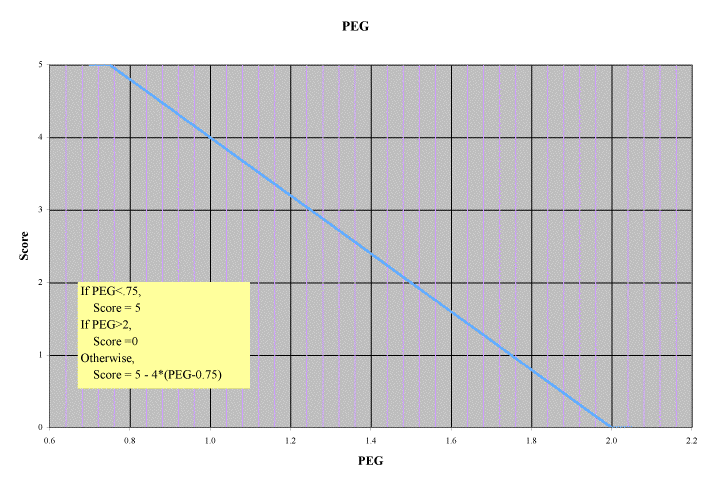
We award value points when the PEG is low as determined by this equation:

Score = 5 - [4*(PEG-0.75)]

As usual, the score is limited to a range between 0 and five points.

A PEG less than or equal to 0.75 earns the full five points, and PEG ratios greater than 2.0 get none.

Price/Revenue
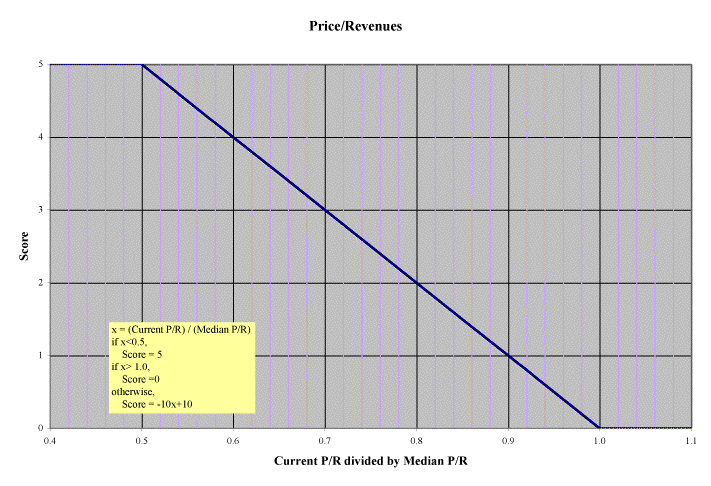
A lower-than-normal Price/Revenue ratio may also be a sign value.  For this reason, we give the company value points when its Price/Revenue ratio is less than its median value over the previous 16 quarters.

Score = (-10) * [(Price/Revenue / (Median Price/Revenue)] + 10

If the Price/Revenue is 50 percent of its median value, or less, the company gets 5 points.

Enterprise Value/Cash Flow
Enterprise Value/Cash Flow is similar to Price/Cash Flow from Operations, but it substitutes Enterprise Value for Market Value.

Enterprise Value is Market Value, plus Debt (long- and short-term), minus the company's Cash and Short-term Investments.  EV is considered a better estimate of the cost to a corporate acquirer than the Market Value because the acquirer is assuming the debt, less any cash on hand that can be used to pay off the debt.

We give the company value points when its EV/CFO ratio is less than its median value over the previous 16 quarters.
Score = (-20) * [(EV/CFO / Median EV/CFO)] + 20

The five-point maximum score is attained when the EV/CFO ratio is 75 percent or less than its median value.

Determining the Value Score
We use the following weights for the different Value score components.


The Value score is 5 * (the sum of each component's score multiplied by its weight) / (100, the total of the weights).


Note: This post was last updated on 1 August 2010.

02 November 2006

The Profitability Gauge

The Profitability gauge score depends on the current and past values for the following quantities:
The Income Statement has the greatest effect on the Profitability gauge, but data from the Balance Sheet and the Cash Flow Statement are also employed.

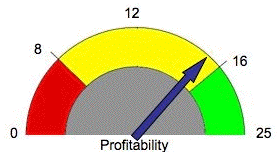
The Profitability gauge is determined by calculating a score for each of the four quantities listed above.  A weighted average of the scores is scaled to set its minimum value at zero and its maximum value at 25 points.

We're tough graders: it's rare for a company to achieve a 25-point Profitability score.

The scoring details are described below.  Please note there is an overriding zero-point floor and a five-point ceiling for each ratio.


Operating Expenses/Revenue Score


We give points for reducing the Operating Expenses/Revenue ratio over the course of a year.

Score = (50)*(decrease in Operating Expenses / Revenue),

The ratio is expressed as a decimal.  An increase in the ratio from one year to the next automatically gets zero points.
 
The five-point maximum is obtained when the reduction is 10 percent:  (50) * (0.1) = 5.

In our sample Income Statement, GCFR Inc.'s ratio of Operating Expenses / Revenue decreased from 25.2 percent to 24.7 percent.  This 0.5 percent decrease would earn (50) * (0.005) = 0.25 points.

Return on Invested Capital Score


There are two components to the ROIC score. The first component, which we cap at 4 points, is:

Score = 16 * ROIC

The ROIC is expressed as a decimal.  Note that the four-point limit is hit when ROIC hits 25 percent (0.25).

The second component is a one-point bonus that is awarded only if the ROIC for the last four quarters exceeds the ROIC for the four previous quarters.

In our sample Income Statement, GCFR Inc.'s ROIC was 8.8 percent.  This performance merits 1.4 points (16 * 0.088), with the possibility of one-point bonus.


FCF/Invested Capital Score


There are two components to the Free Cash Flow/Invested Capital score. The first component, which we cap at 4 points, is:

= 16 * (FCF/Invested Capital)

Note that the four-point limit is hit when FCF/Invested Capital hits 25 percent (16) * (0.25) = 4.

The second component is a one-point bonus when the FCF/Invested Capital for the last four quarters exceeds the FCF/Invested Capital for the four previous quarters.

In our sample Cash Flow Statement, GCFR Inc's FCF/Equity was 12.7 percent.  This performance merits 2.0 points (16 * 0.127), with the possibility of one-point bonus.


Accrual Ratio Score


Recall that the Accrual Ratio is proportional to the difference between Net Income and CFO.  A negative Accrual Ratio indicates that CFO exceeds Net Income, which is suggestive of high-quality, operations-driven earnings.

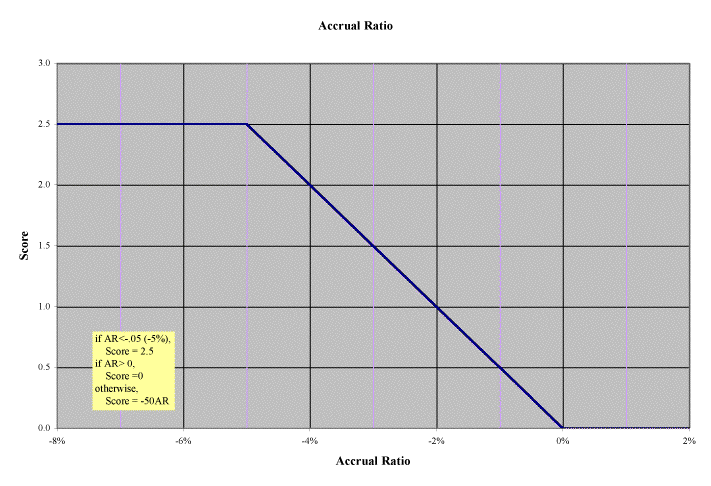
Our score for the Accrual Ratio has two components: the first is proportional to the ratio's value, and the second is proportional to the ratio's change from the previous year.

The first component of this score, worth 2.5 points, is determined by the following equation:

Score = 0, if the Accrual Ratio is positive

= (-50) * Accrual Ratio, if the Accrual Ratio is negative.

The 2.5-point cap is hit when the Accrual Ratio is -5.0 percent or lower.


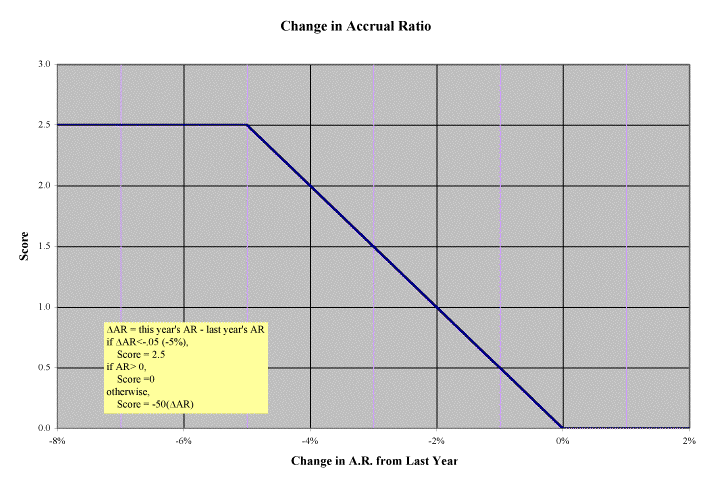
The second component of this score, worth another 2.5 points, is determined by this equation:

Score = 0, if the Accrual Ratio is higher than it was one year ago

=50 * (decrease in Accrual Ratio), if the Accrual Ratio has dropped


If the Accrual Ratio dropped from -0.5 percent to -1.2 percent, the score would be:

(-50)*(-0.012) + (50)*(0.007) = 0.95 points.

Determining the Profitability Score


We use the following weights for the different Profitability score components.

The Profitability score is 5 * (the sum of each ratio's score multiplied by its weight) / (100, the total of the weights).


Note: This post was last updated on 1 August 2010.

31 October 2006

The Growth Gauge


The Growth gauge score depends on the rate at which the company has increased the following quantities:

The Income Statement has the greatest effect on the Growth gauge, but data from the Balance Sheet and the Cash Flow Statement are also employed.

The Growth gauge is determined by calculating a score for each of the five quantities listed above.  A weighted average of the scores is then scaled to set the minimum value at zero and the maximum value at 25 points.

We're tough graders: it's rare for a company to achieve a 25-point Growth score.

The scoring details are described below.  Please note there is an overriding zero-point floor and a five-point ceiling for each growth component.


Revenue Growth

Using the quarterly Revenue figures on eight sequential Income Statements, the Revenue growth rate is found comparing Revenue in the last four quarters to Revenue in the four previous quarters.  

1.  If Revenue growth is negative (i.e., Revenue was less in the last four quarters), the score is zero points.

2.  If the growth rate exceeds 5 percent, then 0.15 points are given for each percentage point above 5 percent, up to a total of 3 points.  A growth rate of 25 percent or higher would earn all 3 points.  [0.15 * (25 - 5)]= 3.

3.  If the growth rate exceeds its four-year average, a bonus point is earned.

4.  If the growth rate is greater than it was one year earlier, a bonus point is earned.

5.  If the latest growth rate exceeds the growth rate calculated after each of the three previous quarters, a bonus point is earned.

6. The rules above could produce a score as great as 6 points.  If the score is greater than five, it is reduced to five points.


Revenue/Assets Growth
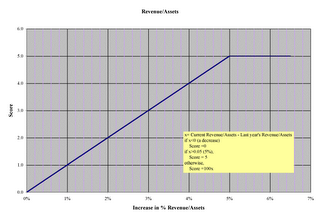


For each percentage point that the Revenue/Assets ratio is higher than it was one year earlier, up to five percentage points, a point is awarded.

Revenue/Assets is found by dividing the Revenue in the last four quarters by the average Total Assets over these four quarters.  It is expressed as percent.

This score rewards companies that grow their Revenue faster than they increase their Assets.

No points are given if Revenue/Assets is declining or if there was no Revenue growth.

If, for example, Revenue/Assets increased from 83.2 percent to 85.5 percent, the score would be 3.3 points as long as Revenue also increased from the previous year.


Operating Profit Average Growth


The Operating Profit growth rate is the average 12-month rate of increase, over the last 16 quarters, of Operating Profit after Taxes. 

1.  If Operating Profit growth is negative (i.e., Operating Profit is declining), the score is zero points.

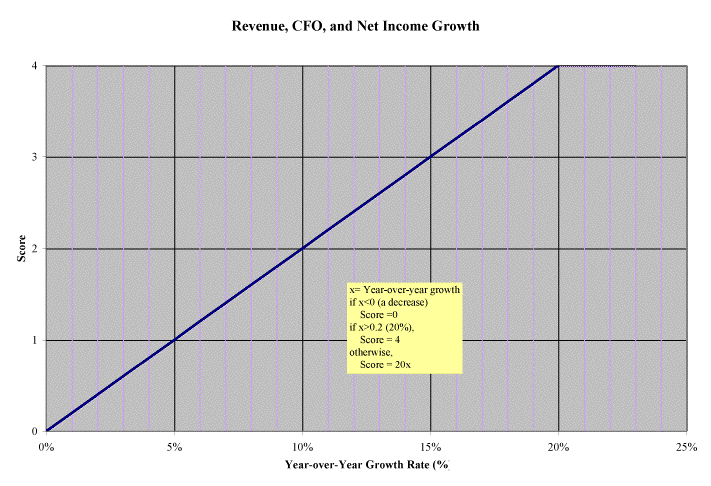
2.  If the growth rate is positive, then the score is 20 * Operating Profit growth rate (as a decimal), up to a total of 4 points.  A growth rate of 20 percent or higher would earn all 4 points.  [20 * (0.2)]= 4.

3. If the latest Operating Profit growth rate exceeds the growth rate calculated one year earlier, a bonus point is earned.


Net Income Growth

The Net Income growth rate is found by comparing Net Income in the most recent four quarters to Net Income in the four previous quarters.  

1.  If Net Income growth is negative (i.e., Net Income is declining), the score is zero points.

2.  If the growth rate is positive, then the score is 20 * Net Income growth rate (as a decimal), up to a total of 4 points.  A growth rate of 20 percent or higher would earn all 4 points.  [20 * (0.2)]= 4.

3. If the latest Net Income growth rate exceeds the growth rate calculated after each of the three previous quarters, a bonus point is earned.


Cash Flow from Operations Growth

The CFO growth rate is found by comparing CFO in the most recent four quarters to CFO in the four previous quarters.  

1.  If CFO growth is negative (i.e., CFO is declining), the score is zero points.

2.  If the growth rate is positive, then the score is 20 * CFO growth rate (as a decimal), up to a total of 4 points.  A growth rate of 20 percent or higher would earn all 4 points.  [20 * (0.2)]= 4.

3. If the latest CFO growth rate exceeds the growth rate calculated after each of the three previous quarters, a bonus point is earned.


Determining the Growth Score

We use the following weights for the different Growth score components:
The Growth gauge score is 5 * (the sum of each component score multiplied by its weight) /  (100, the sum of the weights).


This post was last modified on 30 July 2010.

29 October 2006

The Cash Management Gauge

The Cash Management gauge score depends on the current and past values for the following ratios:
 
Most of the data required to compute the ratios are drawn from the Balance Sheet, but some figures from the Income Statement and the Cash Flow Statement are also used.

The Cash Management gauge is determined by calculating a score for each of the eight items listed above.  A weighted average of the scores is scaled to set its minimum value at zero and its maximum value at 25 points.

We're tough graders: it's a rare company that will achieve a 25-point Cash Management score.

The scoring details are described below.  Please note there is an overriding zero-point floor and a five-point ceiling for each ratio.


Current Ratio


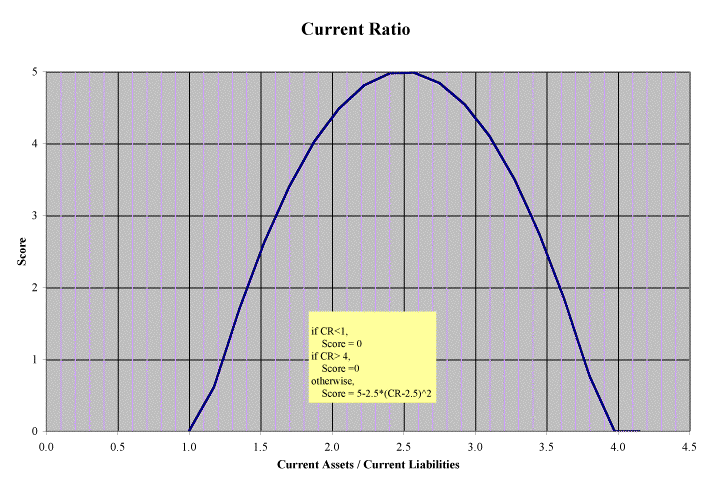
Score = 5 - 2.5 * (Current Ratio - 2.5) ^ 2

In our sample Balance Sheet, GCFR Corp. had a Current Ratio was 75/41 = 1.83.  It would earn 3.9 points.

The maximum score of 5 is attained when the Current Ratio = 2.5.  Points are deducted for higher Current Ratios, which might seem strange, because the company is building its bank account instead of putting its assets to work.


LTD/Equity
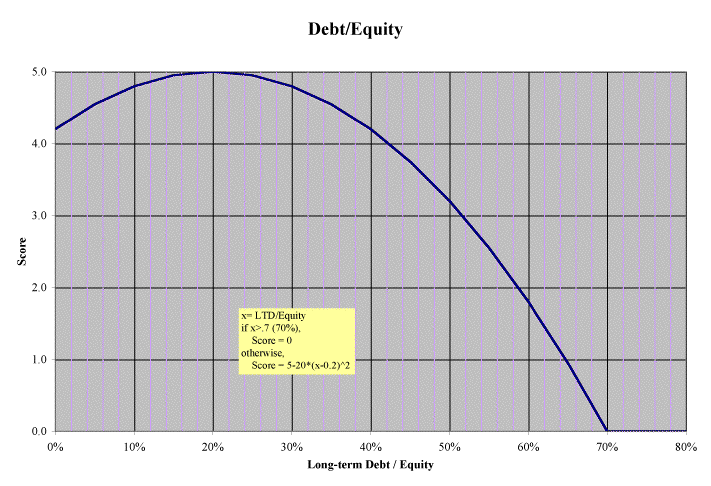
Score = 5.0 - 20*(LTD/Equity -0.2)^2

In our sample Balance Sheet, GCFR Corp. had an LTD-to-Equity ratio of 60/134 = 44.8 percent.  It would earn 3.8 points.

The maximum score of 5 is attained when Long Term Debt to Equity equals 20 percent.  The equation is constructed such that a company with an LTD/Equity ratio between 0 and 40 percent will get at least 4 out of the 5 possible points.  We think some debt is appropriate because it gives stockholders leverage, but we disapprove of excessive debt.

Debt/CFO

Score = (-1.5) * Debt/CFO + 5.25

Debt/CFO is measured in years.

A bonus point is awarded if Debt/CFO is lower that it was one year earlier.

In our sample Balance Sheet, GCFR Corp. had a Debt-to-CFO ratio of 16.6 months = 1.38 years.  It would earn 3.2 points.


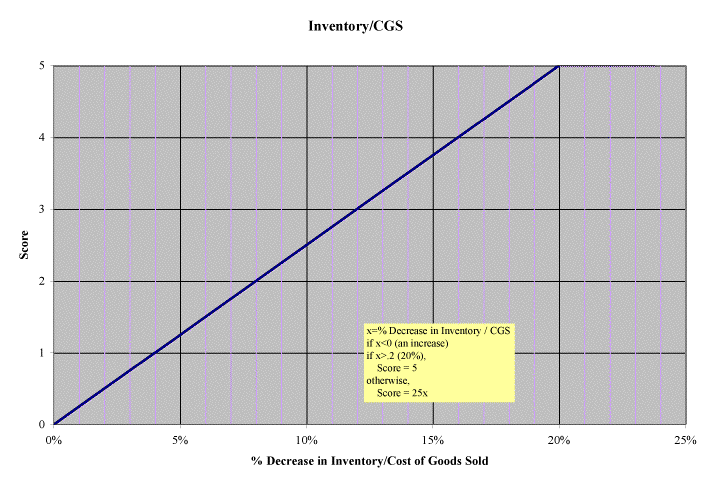
Inventory/CGS
Score = 25 * (delta Inventory-to-CGS / Inventory-to-CGS one year earlier)

Inventory-to-CGS is measured in days.

A 20 percent (i.e., 0.2) reduction in the number of Inventory days will achieve the full five points (25 * 0.2).

In our sample Balance Sheet, GCFR Corp. had a Inventory/CGS ratio = $13/0.433 = 30 days.  It the ratio was 33 days one-year earlier,  then the percent reduction would 3/33 = 0.091.  It would earn 2.8 points.

We don't use this ratio if inventory isn't significant for the company (e.g., the company sells a service, not a product).

Finished Goods/Inventory
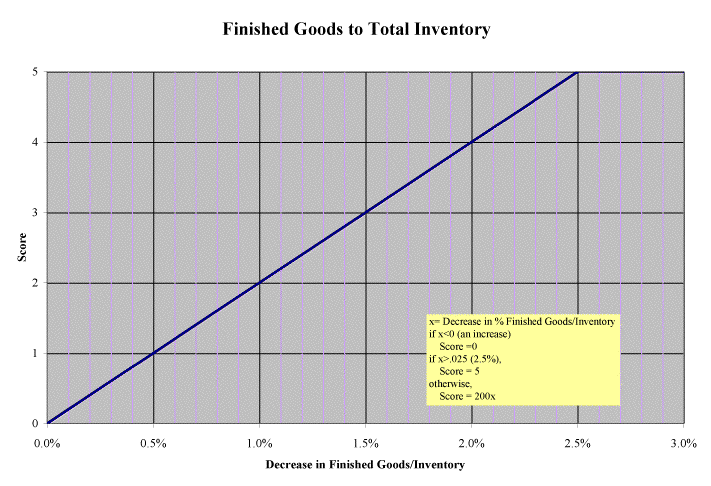
Score = 200 * (decrease in the Finished Goods ratio from its median value)

If the current percentage of inventory made up of finished goods is above this ratio's median value, no points are earned.

A company gets the full 5 points if the current value of the finished good ratio is 2.5 or more percent less than its median value.

We don't use this ratio for scoring if the company's inventory doesn't consist of varying mix of raw materials, work in process, and finished goods (e.g., the company is a retailer), or if inventory isn't significant for the company (e.g., the company sells a service, not a product).

For example, let's say the finished goods component of inventory (the rest being raw materials and work in process) is now 28 percent and that the median value for this ratio is 30 percent.  The 2-percent reduction, worth 4 points, suggests that the company's sales were greater than expected.  The opposite, an increase in finished good inventory, is worrisome.


Days of Sales Outstanding

Score = 25 * (delta DSO / DSO one year earlier)

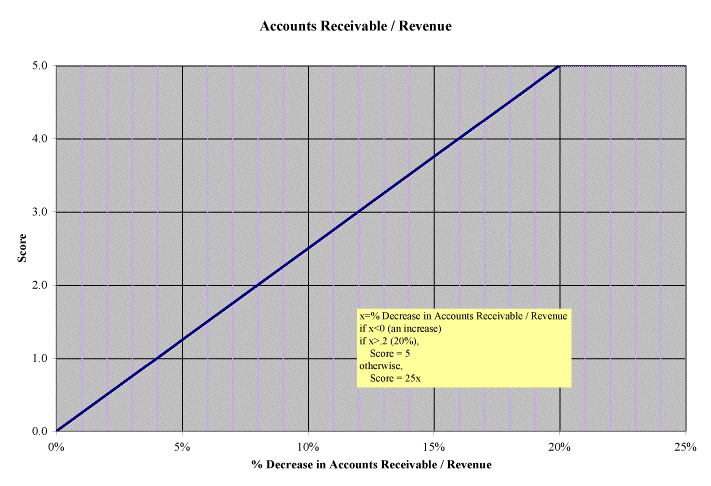
A 20 percent (i.e., 0.2) reduction in DSO is needed to earn the full five points (25 * 0.2). Lesser reductions will get lower scores. The score will be zero if there is no reduction.

For example, if GCFR Corp.'s Balance Sheet shows that Accounts Receivable averaged $12 million over the last year, and if its Revenue during the year was $200 million, then Receivables were 0.06 of annual Revenues, which is 21.9 days of Revenue.  If last year's figure was 23.9 days, then the score would be 25 * (2/23.9) = 2.1 points.

Working Capital/Revenue


Score =  ((-8.75) * WorkingCapToRevenue) + 3.5

Negative Working Capital results in a 3.5-point score.

1.5 bonus points are awarded if the ratio is lower that it was one year earlier.

The maximum score would be earned when Working Capital is negative and has become less as a percentage of Revenue.

In our sample Balance Sheet, GCFR Corp. had Working Capital of $75 million minus $41 million = $34 million on 30 June 2006.  During the previous year, the GCFR Income Statement lists Net Income of $20.1 million  Therefore, the Working Capital to Revenue ratio equals 34/20.1= 1.7, and no points would be awarded with the possible exception of the bonus 1.5 points.

Cash Conversion Cycle Time


Score = (1/2) * (percent decrease in CCCT from last year)

No score is allowed to be less than zero or greater than five.

In other words, each two percent decrease in CCCT earns another score point.

In our sample Balance Sheet, GCFR Corp. had a CCCT of 37 days.  If  this parameter had been 40 days one year earlier, then it decreased by 3/40 = .075 (7.5 percent).  This would earn 7.5/2 = 3.75 points.


Determining the Cash Management Score
We don't simply add up the scores described above to calculate the Cash Management score.  We believe some ratios are more significant than others.  To be specific, we use the following weights:

The Cash Management score is 5 * (the sum of each ratio's score multiplied by its weight) / (100, the total of the weights).


This post was last modified on 5 February 2010