 The Profitability gauge score depends on the current and past values for the following quantities:
The Income Statement has the greatest effect on the Profitability gauge, but data from the Balance Sheet and the Cash Flow Statement are also employed.
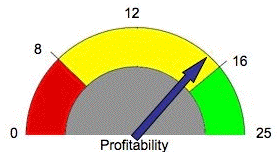
The Profitability gauge is determined by calculating a score for each of the four quantities listed above. A weighted average of the scores is scaled to set its minimum value at zero and its maximum value at 25 points.
We're tough graders: it's rare for a company to achieve a 25-point Profitability score.
The scoring details are described below. Please note there is an overriding zero-point floor and a five-point ceiling for each ratio.
Operating Expenses/Revenue Score
 We give points for reducing the Operating Expenses/Revenue ratio over the course of a year.
Score = (50)*(decrease in Operating Expenses / Revenue),
The ratio is expressed as a decimal. An increase in the ratio from one year to the next automatically gets zero points.
The five-point maximum is obtained when the reduction is 10 percent: (50) * (0.1) = 5.
In our sample Income Statement, GCFR Inc.'s ratio of Operating Expenses / Revenue decreased from 25.2 percent to 24.7 percent. This 0.5 percent decrease would earn (50) * (0.005) = 0.25 points.
Return on Invested Capital Score
 There are two components to the ROIC score. The first component, which we cap at 4 points, is:
Score = 16 * ROIC
The ROIC is expressed as a decimal. Note that the four-point limit is hit when ROIC hits 25 percent (0.25).
The second component is a one-point bonus that is awarded only if the ROIC for the last four quarters exceeds the ROIC for the four previous quarters.
In our sample Income Statement, GCFR Inc.'s ROIC was 8.8 percent. This performance merits 1.4 points (16 * 0.088), with the possibility of one-point bonus.
FCF/Invested Capital Score
 There are two components to the Free Cash Flow/Invested Capital score. The first component, which we cap at 4 points, is:
= 16 * (FCF/Invested Capital)
Note that the four-point limit is hit when FCF/Invested Capital hits 25 percent (16) * (0.25) = 4.
The second component is a one-point bonus when the FCF/Invested Capital for the last four quarters exceeds the FCF/Invested Capital for the four previous quarters.
In our sample Cash Flow Statement, GCFR Inc's FCF/Equity was 12.7 percent. This performance merits 2.0 points (16 * 0.127), with the possibility of one-point bonus.
Accrual Ratio Score
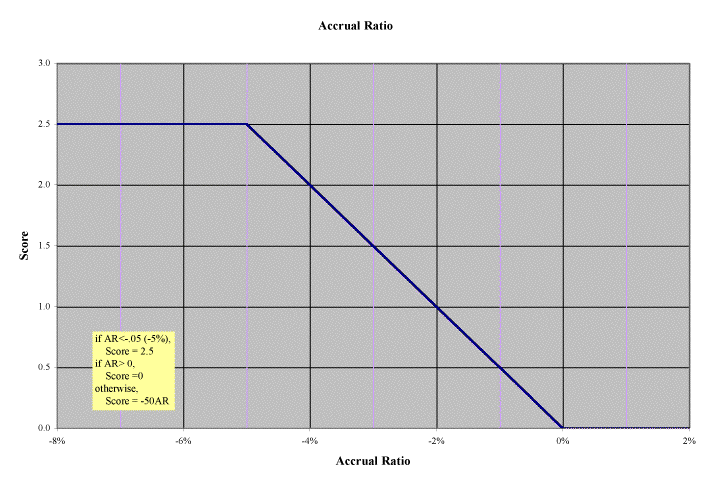 Recall that the Accrual Ratio is proportional to the difference between Net Income and CFO.
A negative Accrual Ratio indicates that CFO exceeds Net Income, which
is suggestive of high-quality, operations-driven earnings.
Recall that the Accrual Ratio is proportional to the difference between Net Income and CFO.
A negative Accrual Ratio indicates that CFO exceeds Net Income, which
is suggestive of high-quality, operations-driven earnings.Our score for the Accrual Ratio has two components: the first is proportional to the ratio's value, and the second is proportional to the ratio's change from the previous year.
The first component of this score, worth 2.5 points, is determined by the following equation:
Score = 0, if the Accrual Ratio is positive
= (-50) * Accrual Ratio, if the Accrual Ratio is negative.
The 2.5-point cap is hit when the Accrual Ratio is -5.0 percent or lower.
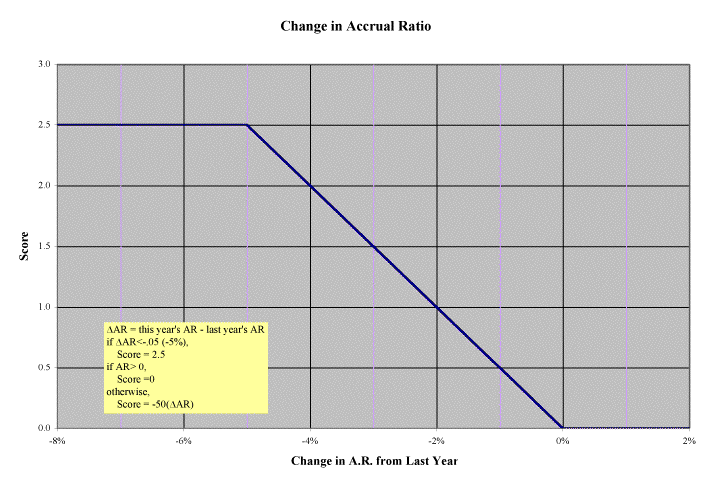
The second component of this score, worth another 2.5 points, is determined by this equation:
Score = 0, if the Accrual Ratio is higher than it was one year ago
=50 * (decrease in Accrual Ratio), if the Accrual Ratio has dropped
If the Accrual Ratio dropped from -0.5 percent to -1.2 percent, the score would be:
(-50)*(-0.012) + (50)*(0.007) = 0.95 points.
Determining the Profitability Score
We use the following weights for the different Profitability score components.
- Operating Expenses / Revenue Score (27.5)
- ROIC Score (32.5)
- FCF/Invested Capital (27.5)
- Accrual Ratio Score (12.5)
The Profitability score is 5 * (the sum of each ratio's score multiplied by its weight) / (100, the total of the weights).
Note: This post was last updated on 1 August 2010.


No comments:
Post a Comment