Down about 20 percent in 2006, Intel was the worst performer in the Dow Jones Industrial Average in a year that turned out to be pretty good for stocks. It will get attention as a rebound candidate from those that subscribe to the Dogs of the Dow theory. Is there evidence to support an expectation of a bounce back? As explained below, we don't see it in the financial results through the quarter ending in September 2006.
Cash Management. Intel's cash management gauge reads 6 out of 25 possible points. When we dig into this, we see that the points reflect the company's first-rate financial strength, rather than operating efficiencies. We don't need to worry for a nanosecond about this company's creditworthiness, but we'll note for the record that the current ratio is a solid 1.94. This figure is down somewhat from previous years, probably because the company has been using its cash hoard for capital investments and to buy back stock. Long-term debt to equity is a scant 6 percent, which might be surprising given how expensive it is to build and retool chip foundries. Accounts receivable are 34 days of revenue, which is down a bit (good) from recent levels. On the other hand, and this is important, the company is holding 101 days of inventory, as measured by the cost of goods sold. This is the highest inventory level in 10 years and far above the five-year median value of 67 days. When coupled with the fact that finished goods constitute 37 percent of inventory, which is at the upper end of its historic range, we can't be optimistic about future revenue growth and pricing power.
Growth. The growth metrics are horrible, with the company undeserving of a single point of the 25 possible on the growth gauge. Revenues are down 6 percent year-over-year. Cash flow from operations is down 33 percent. Net income is down 28 percent. Revenue/assets is 77 percent, down from 81 percent a year ago, but within the historic range.
Profitability. Also dismal. This gauge reads 5 out of 25 points. The accrual ratio is +4 percent. A negative number is preferred for this ratio, and it was negative for Intel a year ago. The return on invested capital in 17 percent, which is the slimmest ROIC figure in the last 3 years. At 12 percent, free cash flow to equity has taken an even steeper decline. And, to put the final nail in the coffin, a 79-percent ratio of operating expenses to revenue is 10 percentage points higher than a year ago.
Valuation. A sad 4 of 25 possible points. This suggests that the fall in the stock price hasn't been painful enough to account for the poor operating performance. Since net income is contracting, the PEG ratio is meaningless. The trailing P/E ratio is 20, a 30 percent premium to the market, which is odd unless one knows of a reason (Vista?) to believe future earnings growth will outpace the market. Price/Sales, down to 3.3, is the one sign of value; it suggests that a turnaround in revenues might translate into a stock price gain.
Overall. Rolling up all of the above, the overall gauge stands at a weak 16 out of 100 possible points. It's almost sad to see how fast this once-mighty bellwether has fallen. However, the semiconductor market is notoriously cyclic. Intel has bounced back before from bad market conditions. Will there be early warning signs of a comeback? We would look first at the total inventory level and then at the finished goods component of the total inventory. A drop in these figures, assuming no inventory write-down, would indicate an uptick in demand for the company's products.
25 December 2006
24 December 2006
HD: Analysis through Oct 2006
 In a remarkably short period of time, Home Depot has morphed from a premier growth stock to a potential value stock. The shares can't seem sustain a price rise no matter how many billions the company spends on buybacks, nor how many times they hike the dividend.
Unfortunately, the reasons for optimism are few indeed. One possibility raised in the media (and quickly denied) was that a hedge fund or two might offer to buy the company. A cynic might believe this rumor was floated by short-term traders looking to boost the stock price for quick profit. We'll see.
Cash Management. This gauge reads 5 points of the 25 possible. The current ratio was a mere 1.17 after the quarter ending in October. Accounts receivable to revenue were 15 days, whereas receivables were reliably less than 10 days from 1994 to 2004. The company is holding 83 days worth of inventory, as measured by cost of goods sold. Inventory levels have been edging up modestly. Against the same measure, Wal-Mart has about 50 days of inventory. At least debt is under control: we consider the LTD/Equity value of 24 percent to be ideal. To be fair, there's no evidence to suggest that improvements to any of the cash management parameters would translate into stock price gains. In fact, we see the opposite situation. The cash management score has a negative correlation with stock price performance.
Growth. The growth gauge also stands at 5 out of 25 possible points. While revenue increases of 14 percent does not a growth stock make, it is, at least, better than more anemic results over the last few years. Revenue/assets equals 1.71, continuing a long trend of less efficient use of resources. While the company brings in more than $6 billion of operating cash flow every 4 quarters, the amount has been more or less static for more than four years. Net Income growth had been a better story, but the weak 9 percent year-over-year growth seen in the latest results is troubling.
Profitability. Only 7 of 25 points here. The accrual ratio is +6 percent (negative values are ideal). This can be attributed to the failure to increase cash flow from operations. We have no particular complaint with 18 percent return on invested capital other than that we were seeing values in the low 20 percents not that long ago. You can probably guess that there is nothing in the free cash flow to equity value of 11 percent to get us excited. The same is true for the operating expenses to revenue figure, which is stuck at 89 percent.
Value. All of the preceding was insignificant, compared to the Value gauge. Of the four gauges, it is the only one that correlates well (correl. coeff. = 0.6) with Home Depot's stock price. The current score of 12 of 25 points reflects how inexpensive the stock has become, but it's not a raging buy sign. The PEG ratio is 1.33 (using the 31 Oct stock price of $37.33, per our custom). The trailing P/E was 12.5. Price/revenue was 0.85. And, the P/E was only 78 percent of the S&P 500 P/E.
Overall. The overall gauge, after the October 2006 quarter, reads 34 out of 100 possible points. When the score bumped up to 45 after the July 2006 quarter, we were hoping October's results would show a confirmation that HD had turned the corner. We were disappointed.
11 December 2006
KG: Analysis through Sept 2006
King Pharmaceuticals develops, manufactures, and markets a diverse array of pharmaceutical products. Over the last few years, KG has had its share of problems, including Medicaid overcharge allegations, inventory write-downs, financial restatements, and a proposed merger with Mylan Labs that fell apart after Carl Icahn raised objections.
Our analysis indicated that King turned the corner in the second and third quarters of 2005. The scores shown on the Overall gauge were in the upper 70's at the conclusion of both of these two quarters, after having been in the 20's three previous quarters. [The stock price on 30 June 2005 was $10.42, and it was around $17 most of 2006.] The scores then cooled off to around 50 points at the end of 2005 and beginning of 2006.

As will be shown below, the scores dropped further when we looked at King's results from the quarter that ended on 30 September 2006.
Cash Management: The Current Ratio was a solid 2.65, its highest level in about three years. Long-Term Debt/Equity was an affordable 18 percent; the debt ratio has been between 17 and 20 percent for most of the last several years. Accounts Receivable/Revenue have also been stable at around 50 days. The big news of the September quarter was that Inventory/CGS dropped to 179 days; this was the first time the Inventory level went below 200 days since March 2003. The Finished Goods percentage of Inventory was 30 percent, which was consistent with historical data.
Growth: Revenue growth decelerated to 12 percent year over year; the growth rate had been much higher the five previous quarters. Net Income dropped 30 percent over this period, but the results were skewed by special charges. Operating Profit was actually up 24 percent. Cash Flow from Operations was 19 percent less than during the previous year. Revenue/Assets was 58 percent, down a little from recent quarters, but much higher than the historic average.
Profitability: The ROIC was 16 percent, down from a strong 20 percent one year earlier. FCF/Equity was (coincidentally) also 16 percent, and it had also weakened from the year-earlier value. Operating Expenses/Revenue was 68 percent; this value had been going down, but might have stabilized. The Accrual Ratio was a nice -6 percent, suggesting high quality earnings, but King often has even better values for this parameter.
Value: It's not easy to establish a baseline for King's valuation metrics because its earnings have been on a roller coaster. At the end of September, the P/E was 26.3, about a 70 premium above the P/E for the S&P 500. We also don't get any insight from the PEG ratio, since negative earnings growth makes the PEG not applicable. Since Revenue is more stable than earnings, we can learn a more about the valuation from the Price/Revenue. At 2.18, it is inline with recent quarters and down quite a bit from the company's salad days.
Our analysis indicated that King turned the corner in the second and third quarters of 2005. The scores shown on the Overall gauge were in the upper 70's at the conclusion of both of these two quarters, after having been in the 20's three previous quarters. [The stock price on 30 June 2005 was $10.42, and it was around $17 most of 2006.] The scores then cooled off to around 50 points at the end of 2005 and beginning of 2006.

As will be shown below, the scores dropped further when we looked at King's results from the quarter that ended on 30 September 2006.
- Cash Management: 17/25 (!)
- Growth: 9/25 (much less than after previous quarters)
- Profitability: 10/25
- Value: 7/25
- Overall: 39/100
Cash Management: The Current Ratio was a solid 2.65, its highest level in about three years. Long-Term Debt/Equity was an affordable 18 percent; the debt ratio has been between 17 and 20 percent for most of the last several years. Accounts Receivable/Revenue have also been stable at around 50 days. The big news of the September quarter was that Inventory/CGS dropped to 179 days; this was the first time the Inventory level went below 200 days since March 2003. The Finished Goods percentage of Inventory was 30 percent, which was consistent with historical data.
Growth: Revenue growth decelerated to 12 percent year over year; the growth rate had been much higher the five previous quarters. Net Income dropped 30 percent over this period, but the results were skewed by special charges. Operating Profit was actually up 24 percent. Cash Flow from Operations was 19 percent less than during the previous year. Revenue/Assets was 58 percent, down a little from recent quarters, but much higher than the historic average.
Profitability: The ROIC was 16 percent, down from a strong 20 percent one year earlier. FCF/Equity was (coincidentally) also 16 percent, and it had also weakened from the year-earlier value. Operating Expenses/Revenue was 68 percent; this value had been going down, but might have stabilized. The Accrual Ratio was a nice -6 percent, suggesting high quality earnings, but King often has even better values for this parameter.
Value: It's not easy to establish a baseline for King's valuation metrics because its earnings have been on a roller coaster. At the end of September, the P/E was 26.3, about a 70 premium above the P/E for the S&P 500. We also don't get any insight from the PEG ratio, since negative earnings growth makes the PEG not applicable. Since Revenue is more stable than earnings, we can learn a more about the valuation from the Price/Revenue. At 2.18, it is inline with recent quarters and down quite a bit from the company's salad days.
30 November 2006
WMT: Analysis through Oct 2006
Wal-Mart (WMT), based in Bentonville, AR, is the world's largest retailer. It operates Wal-Mart stores and Sam's Club warehouses.
Wal-Mart has been a disruptive force, with positive and negative effects, in the U.S. and world economies. These disruptions, when coupled with the company's scale and huge customer base, also makes it a lightning rod for criticism. Wal-Mart revolutionized retailing by using information technology to manage its supply chain and by pressuring manufacturers to squeeze every penny out of their costs. Rival discounters fell by the wayside, and manufacturers with higher costs suffered mightily. On the other hand, Wal-Mart's discounting is responsible for lower inflation (and thus interest rates), although this effect might not have been reflected fully in the published statistics. However, with the U.S. market now saturated, and the company continuing to slash prices, Wal-Mart's growth (as measured by same-store sales) has shrunk to the low single digits. Target, which appeals to a somewhat more affluent customer base, has been eroding Wal-Mart's market share from above. From below, high gas prices have cut the amount of money Wal-Mart's customer have to spend. The stock price, with a few rare exceptions, has been between $43 and $50 per share since March 2005.
When we analyzed WMT after the quarter that ended in July 2006, the Overall score was a modest 36 points. At 14 points, Value was the attribute gauge with the highest score. Cash Management and Profitability were weakest at 4 points.
We have since updated the analysis to incorporate WMT's financial results for the latest quarter, which was the third of fiscal 2007. With data through 31 October 2006, our gauges now display the following scores:
Cash Management. This gauge held steady at 4 points from July to October. The Current Ratio is now 0.85. It has been stable at this level for six years. We generally would prefer to see it higher, but it's a non-issue for WMT. Inventory/Cost of Goods Sold is now 54 days. The inventory level was 46 days at the end of the prior quarter, and it was 57 days at the end of the year-earlier quarter. A review of the historical data indicates that the company always builds inventory in the October quarter for the upcoming holiday season. Therefore, the increase from the second to the third quarter is not worrisome. As a retailer, all of WMT's Inventory is product ready for sale (i.e., Finished Goods). Accounts Receivable/Revenue is 2.7 days. This value trended lower during the late 1990's and the beginning of the current decade, until it bottomed out at 1.5 days in January 2003. It has since be moving higher. The increase, although small, indicates the company ishaving more trouble getting paid by its customers.
Growth. This gauge increased 3 points from July. Revenue growth is 11 percent year over year; it has been holding steady at this level. Net Income growth is 9 percent; it has been holding steady at this modest level for the last and a half, but was significantly higher throughout much of the company's lifetime. Changes in the income tax rate have not been significant enough to have a material effect on Net Income. CFO growth jumped to a strong 25 percent; this rate is the highest in the last three years. Revenue/Assets is 223 percent; it has been trending down, but very slowly. It indicates that the company is becoming somewhat less efficient at generating sales.
Profitability. This gauge increased 1 points from July. ROIC held at a moderate 12 percent. It was also 12 percent a year ago. FCF/Equity held at 7 percent. Years ago, it was in the teens. Operating Expenses/Revenue stayed at 95 percent, which is pretty much where they have always been. Gross Margin and SG&A expenses have been remarkably constant. The Accrual Ratio, which we like to be both negative and declining, edged down to +5 percent. This tells us that more of the company's Net Income is due to CFO, in contrast to changes in balance sheet accruals.
Value. This gauge, based on the stock price of $49.28 at the quarter's end on 31 October, declined to a mediocre 11 points, compared to 14 points 3 and 12 months ago. The P/E at the end of the quarter was 17.5, up a little from recent quarters, but way below the 5-year median of 25. The decrease suggests the shares are becoming less expensive. The average P/E for the industry is 20.7. To remove the effect of overall market changes on the P/E, we note that the company's current P/E is at an 9 percent premium to the average P/E (using core operating earnings) for stocks in the S&P 500. The premium was much higher when the company was growing at faster rate. The PEG ratio of 2.0 is indicative of a modestly expensive stock. It has been increasing slowly (i.e., becoming more expensive. The Price/Revenue ratio has steady 60 percent. The long-term trend is down, suggests the shares are becoming less expensive. The average Price/Sales for the industry is 77 percent.
Now at so-so 32 out of 100 possible points, the Overall gauge has been in the 30's for most of the last four years, with the occasional 20-something or 40 something. There is nothing in these results to suggest that the company's performance is turning a corner.
Wal-Mart has been a disruptive force, with positive and negative effects, in the U.S. and world economies. These disruptions, when coupled with the company's scale and huge customer base, also makes it a lightning rod for criticism. Wal-Mart revolutionized retailing by using information technology to manage its supply chain and by pressuring manufacturers to squeeze every penny out of their costs. Rival discounters fell by the wayside, and manufacturers with higher costs suffered mightily. On the other hand, Wal-Mart's discounting is responsible for lower inflation (and thus interest rates), although this effect might not have been reflected fully in the published statistics. However, with the U.S. market now saturated, and the company continuing to slash prices, Wal-Mart's growth (as measured by same-store sales) has shrunk to the low single digits. Target, which appeals to a somewhat more affluent customer base, has been eroding Wal-Mart's market share from above. From below, high gas prices have cut the amount of money Wal-Mart's customer have to spend. The stock price, with a few rare exceptions, has been between $43 and $50 per share since March 2005.
When we analyzed WMT after the quarter that ended in July 2006, the Overall score was a modest 36 points. At 14 points, Value was the attribute gauge with the highest score. Cash Management and Profitability were weakest at 4 points.
We have since updated the analysis to incorporate WMT's financial results for the latest quarter, which was the third of fiscal 2007. With data through 31 October 2006, our gauges now display the following scores:
- Cash Management: 4 of 25
- Growth: 9 of 25
- Profitability: 5 of 25
- Value: 11 of 25
- Overall: 32 of 100
Cash Management. This gauge held steady at 4 points from July to October. The Current Ratio is now 0.85. It has been stable at this level for six years. We generally would prefer to see it higher, but it's a non-issue for WMT. Inventory/Cost of Goods Sold is now 54 days. The inventory level was 46 days at the end of the prior quarter, and it was 57 days at the end of the year-earlier quarter. A review of the historical data indicates that the company always builds inventory in the October quarter for the upcoming holiday season. Therefore, the increase from the second to the third quarter is not worrisome. As a retailer, all of WMT's Inventory is product ready for sale (i.e., Finished Goods). Accounts Receivable/Revenue is 2.7 days. This value trended lower during the late 1990's and the beginning of the current decade, until it bottomed out at 1.5 days in January 2003. It has since be moving higher. The increase, although small, indicates the company ishaving more trouble getting paid by its customers.
Growth. This gauge increased 3 points from July. Revenue growth is 11 percent year over year; it has been holding steady at this level. Net Income growth is 9 percent; it has been holding steady at this modest level for the last and a half, but was significantly higher throughout much of the company's lifetime. Changes in the income tax rate have not been significant enough to have a material effect on Net Income. CFO growth jumped to a strong 25 percent; this rate is the highest in the last three years. Revenue/Assets is 223 percent; it has been trending down, but very slowly. It indicates that the company is becoming somewhat less efficient at generating sales.
Profitability. This gauge increased 1 points from July. ROIC held at a moderate 12 percent. It was also 12 percent a year ago. FCF/Equity held at 7 percent. Years ago, it was in the teens. Operating Expenses/Revenue stayed at 95 percent, which is pretty much where they have always been. Gross Margin and SG&A expenses have been remarkably constant. The Accrual Ratio, which we like to be both negative and declining, edged down to +5 percent. This tells us that more of the company's Net Income is due to CFO, in contrast to changes in balance sheet accruals.
Value. This gauge, based on the stock price of $49.28 at the quarter's end on 31 October, declined to a mediocre 11 points, compared to 14 points 3 and 12 months ago. The P/E at the end of the quarter was 17.5, up a little from recent quarters, but way below the 5-year median of 25. The decrease suggests the shares are becoming less expensive. The average P/E for the industry is 20.7. To remove the effect of overall market changes on the P/E, we note that the company's current P/E is at an 9 percent premium to the average P/E (using core operating earnings) for stocks in the S&P 500. The premium was much higher when the company was growing at faster rate. The PEG ratio of 2.0 is indicative of a modestly expensive stock. It has been increasing slowly (i.e., becoming more expensive. The Price/Revenue ratio has steady 60 percent. The long-term trend is down, suggests the shares are becoming less expensive. The average Price/Sales for the industry is 77 percent.
Now at so-so 32 out of 100 possible points, the Overall gauge has been in the 30's for most of the last four years, with the occasional 20-something or 40 something. There is nothing in these results to suggest that the company's performance is turning a corner.
27 November 2006
BUD: Analysis through Sept 2006

It was big news, back in the Spring of 2005, when Warren Buffet bought a large stake in Anheuser-Busch (BUD). We ran the numbers to determine if we could identify what led the Sage of Omaha to make this assessment. We couldn't: the numbers were lousy. So, we passed.
Mr Buffet recently cut his stake. What do the numbers look like now? They haven't improved a bit.
- Cash Management:2 (of 25)
- Growth: 7 (of 25)
- Profitability: 10 (of 25)
- Value: 3 (of 25)
- Overall: 21 (of 100)
Cash Management: The Current Ratio is less than 0.9. Long-Term Debt / Equity is a frightening 170%. Accounts Receivable/Revenues are up to 21.1 days from 19.8 days. One positive tidbit: Inventory is 23.7 days (relative to CGS), down from 26.8 days. We can't look at the proportion of Inventory allocated to Finished Goods because BUD has stopped reporting Inventory details in their 10-Q reports (too bad; it's a good indicator).
In a statistical oddity, Revenue Growth and CFO Growth are both a tepid 4.1%. Net Income Growth? A mere 1.0% -- it had been negative after previous quarters. Revenue/Assets has increased from 91.5 to 92.8 percent; a small step in the right direction
The Accrual Ratio is down, which is good, to 0% from 2.7%. The Return on Invested Capital was a reasonable 16 percent, but the company previously attained 20% returns. Free Cash Flow/Equity is an eye-popping 46% (but remember that debt, not equity, dominates the company's capital base). Operating Expenses/Revenues have been oh-so-slowly inching up (so much for cost control) and are now at 82%.
The PEG ratio is about 20 (we prefer somewhere around 1.0). Weak Net Income growth hasn't affected the Price/Earnings, which continues to hold around 19. Price/Revenue is down from 2.8 to 2.4. Remarkably, for a company with next to no growth, BUD commands a premium to the S&P 500.
We like their products. They're a better value than the stock. If you own the stock, you have a more compelling reason to consume the liquid version of BUD.
26 November 2006
TDW: Analysis through Sept 2006
Tidewater (TDW), a rather interesting company, leases ships to firms involved in offshore energy production. When energy prices are high, offshore production becomes more economical, demand for maritime services increases, and TDW can charge more for its vessels. Similarly, when offshore production diminishes, TDW has to work a whole lot harder to find customers for its ships.
TDW's fiscal year ends on March 31. Therefore, September 30, 2006, marked the conclusion of the second quarter of their fiscal year 2007. With the financial reports for that quarter, our financial gauges displayed the following scores:
Revenue growth is a healthy 34 percent (and accelerating). Net Income growth is robust 64 percent (actually down from unsustainable rates of previous quarters). Growth in Cash Flow from Operations is a remarkable 100%. The three growth rates are all year-over-year values, and do not signify a single strong quarter. Revenue/Assets, at 42 percent, is at its highest level in more than four years.
As for profitability, the Accrual Ratio is +4.9 percent (we'd prefer a negative value), but down from +7 percent one year ago. The Return on Invested Capital is 15 percent, up substantially over recent years to a level not seen since 1999. Free Cash Flow/Equity is 11 percent, also up substantially over prior years, when negative ratios were typical. Operating Expenses/Revenue is at its lowest level since 1998.
In keeping with our normal practice, the Value score was computed using the $44.19 stock price on September 30. With that price, we saw a PEG ratio of a minuscule 0.13 and a Price/Earnings ratio of 8.2. This P/E was about half of the S&P 500's P/E, whereas TDW's median P/E is an 8 percent premium to the market. Price/Revenue, at 2.4, was a discount to its median of 2.8.
Not surprisingly, TDW's stock price has advanced nicely since the end of the quarter. As we report this analysis, the stock price is 52.80 (up 19.5 percent!). Are we too late? With the current price, the Value score drops from 20 to a still-strong 17. The P/E ratio is still below 10, and the PEG is a mere 0.15. Cheap.
Potential investors will have to decide for themselves whether this performance can continue.
TDW's fiscal year ends on March 31. Therefore, September 30, 2006, marked the conclusion of the second quarter of their fiscal year 2007. With the financial reports for that quarter, our financial gauges displayed the following scores:
- Cash Management: 10
- Growth: 23
- Profitability: 16
- Value: 20
- Overall: 73 (a superlative result)
Revenue growth is a healthy 34 percent (and accelerating). Net Income growth is robust 64 percent (actually down from unsustainable rates of previous quarters). Growth in Cash Flow from Operations is a remarkable 100%. The three growth rates are all year-over-year values, and do not signify a single strong quarter. Revenue/Assets, at 42 percent, is at its highest level in more than four years.
As for profitability, the Accrual Ratio is +4.9 percent (we'd prefer a negative value), but down from +7 percent one year ago. The Return on Invested Capital is 15 percent, up substantially over recent years to a level not seen since 1999. Free Cash Flow/Equity is 11 percent, also up substantially over prior years, when negative ratios were typical. Operating Expenses/Revenue is at its lowest level since 1998.
In keeping with our normal practice, the Value score was computed using the $44.19 stock price on September 30. With that price, we saw a PEG ratio of a minuscule 0.13 and a Price/Earnings ratio of 8.2. This P/E was about half of the S&P 500's P/E, whereas TDW's median P/E is an 8 percent premium to the market. Price/Revenue, at 2.4, was a discount to its median of 2.8.
Not surprisingly, TDW's stock price has advanced nicely since the end of the quarter. As we report this analysis, the stock price is 52.80 (up 19.5 percent!). Are we too late? With the current price, the Value score drops from 20 to a still-strong 17. The P/E ratio is still below 10, and the PEG is a mere 0.15. Cheap.
Potential investors will have to decide for themselves whether this performance can continue.
25 November 2006
COP: Analysis through Sept 2006

When analyzing Conoco Phillips (COP), we have to accept that the huge merger that formed the company in August 2002 obliterated the utility of the pre-combination financial statements. This was followed in March 2006 by the purchase of Burlington Resources. If we were especially motivated, we could mash together the financial statements for the predecessor companies. However, we would have no way to test the validity of the many assumptions that would be required for this time consuming exercise.
Since four-plus years have passed since its formation, we now have enough data for the 16-quarter median values that we use to put the company's current Price/Earnings and Price/Revenues ratios into a historical context. We need to be aware, however, that our gauges prior to the current period were computed with fewer data points than typical. We also have precious little data about how the Burlington acquisition might alter these values.
We also need to remember that COP's performance is driven, first and foremost, by the price of oil. If the latter rises, COP will look good irrespective of the esoteric ratios to which we give so much attention.
After the 3Q of 2006, the following scores were computed for our analytical gauges:
- Cash Management: 5
- Growth: 12
- Profitability: 8
- Value: 11
- Overall: 38
Because two of our five Cash Management score components, Inventory/CGS and Finished Goods to Total Inventory, don't have the significance they do for a product manufacturer (we like lean inventories for the latter), we have to rely on the other components when evaluating COP. The Current Ratio is 0.9, which might be sufficient, but it's too low to get points in our scoring system. Long-Term Debt/Equity is an ideal 30 percent, suggesting that COP isn't overextended in spite of its merger spree. Receivables are 24.6 days of revenue, up from 22.7 in September 2005, which is not the direction we prefer.
We see very good Growth in Revenue (15%), CFO (27%), and Net Income (31%). However, each of these rates are substantially less than they had been after prior quarters. Revenue/Assets, at 118%, is a concern because it is much less than the rate a year ago. We suspect that the merger with Burlington Resources increased the asset base more than it did revenues.
On the Profitability side, the Accrual Ratio reduction from 9 to 6 percent is a welcome change, but, remember, our ideal is a negative Accrual Ratio (i.e., Cash Flow exceeding Net Income). Return on Invested Capital is a reasonable 13 percent, but it was higher in 2005. FCF/Equity is a little below 7.5 percent, which is just OK. Operating expenses/Revenue at 87% have been coming down, but only by 2% per year.
Assuming a stock price of around $60 per share, the PEG ratio is mere 0.2, indicating that the stock was selling at a huge discount to earnings growth. The P/E itself is a low 6.2, which is about 40 percent of the equivalent figure for the S&P 500. However, it is in-line with historical figures. Price/Revenue is right at its median value of 0.5.
Overall, we see a profitable company with mixed and, in some cases, weakening fundamentals. We see COP strictly as a play on oil prices. If the latter increase, the resulting growth in Net Income would almost certainly be reflected one-for-one into the stock price because it's hard to see the P/E or PEG going any lower.
23 November 2006
ADP: Analysis through Sept 2006
Using the results of the quarter ending 30 September 2006, ADP's scores were:
Cash Management:10
Growth: 15
Profitability: 10
Value: 3
Overall: 31
The first three scores are good, but the overall score is dragged down by the highly weighted (45 percent) Value score. This suggests that the company's solid financial performance is already reflected in the stock price.
We should note that ADP is one company where our analytical scores have a negative correlation with stock price gains. We might not be looking at the right parameters for this service company.
Let's look at the Valuation parameters more closely. An earlier post identified the components of our Value gauge as being Price/Earnings, Price/Earnings market premium, PEG ratio, and Price/Revenue.
ADP's P/E was 23.6 on 30 Sept, which is a small plus because the P/E is slightly below its 25.8 median value. The current P/E is a 51 percent premium relative to the S&P 500, which is a trivial amount below its 55 percent median premium. The PEG ratio is 2.1, which is too high to signal a value play. The current Price/Revenue is 2.9, which is not enough below its 3.2 median to get our attention.
PEP: Analysis through Sept 2006
We used PepsiCo in numerous posts of this blog to illustrate the organization of financial statements, how we evaluate these statements, and our gauges to depict the analysis results in a simple, easy-to-understand way.
In this post, we have consolidated the analysis results for PEP. It was performed using financial data through the quarter ending in September 2006.
The Cash Management gauge read a mere 3.5 out of 25 possible points. The Current Ratio was 1.3, which is rather low. We don't consider this to be a problem because the company has long thrived with a low Current Ratio. On the other hand, LTD/Equity at 16 percent is nearly ideal. This debt ratio was higher in previous years, when the company was digesting acquisitions. Inventory levels, as measured by Cost of Goods Sold, stood at 46.2 days. This is in line with historic levels, but we're a little concerned that Inventory increased by 6.5 percent from the year-earlier quarter. The percentage of Inventory that is product ready for sale (i.e., Finished Goods) edged up from its historic average. This bears watching because it might presage a sales slump. Accounts Receivable/Revenues has been increasing. If we knew the Chief Financial Officer, we would ask why.
The Growth gauge displays an excellent 19 of 25 possible points. Year-over-year Revenue Growth was 11.5 percent, and Net Income Growth was an impressive (and accelerating) 27 percent. The Net Income growth was helped by non-recurring taxes in the earlier year. Also impressive was an increase in Revenue/Assets from 101 percent to 108 percent. The growth story was only marred by a 5.2 percent drop in CFO.
The Profitability score was 9 of 25 possible points. The ROIC was 26.4 percent, significantly above the 21.5 percent at the end of the September 2005 quarter. FCF/Equity was a healthy 22.0 percent, but down from the year-earlier 31.3 percent. Operating Expenses/Revenue have edged up in a year from 80.9 percent to 81.3 percent. The expense ratios have been remarkably constant at PepsiCo for many years. The Accrual Ratio was +4.5 percent at the end of the last quarter, compared to -1.6 percent at the end of the year-earlier quarter. This is disappointing on the basis of the absolute value of the Accrual Ratio -- negative value are better than positive -- and its direction.
The Value gauge score was 4 of 25 possible points. The P/E at the end of September was 22.2, which is below the 23.6 median value (suggesting some room for expansion). The current P/E corresponded to 1.42 (42 percent) premium relative to the S&P 500; since this is greater than PEP's 1.28 historical premium, no value points are earned. More promising, the PEG ratio of 22.2/26.8 = 0.83 is indicative of value for a growing company. The Price/Revenue ratio was 3.16, which exceeded its median value of 3.01.
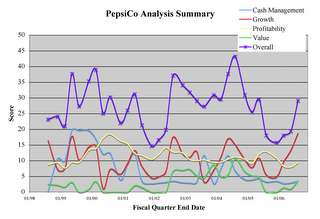
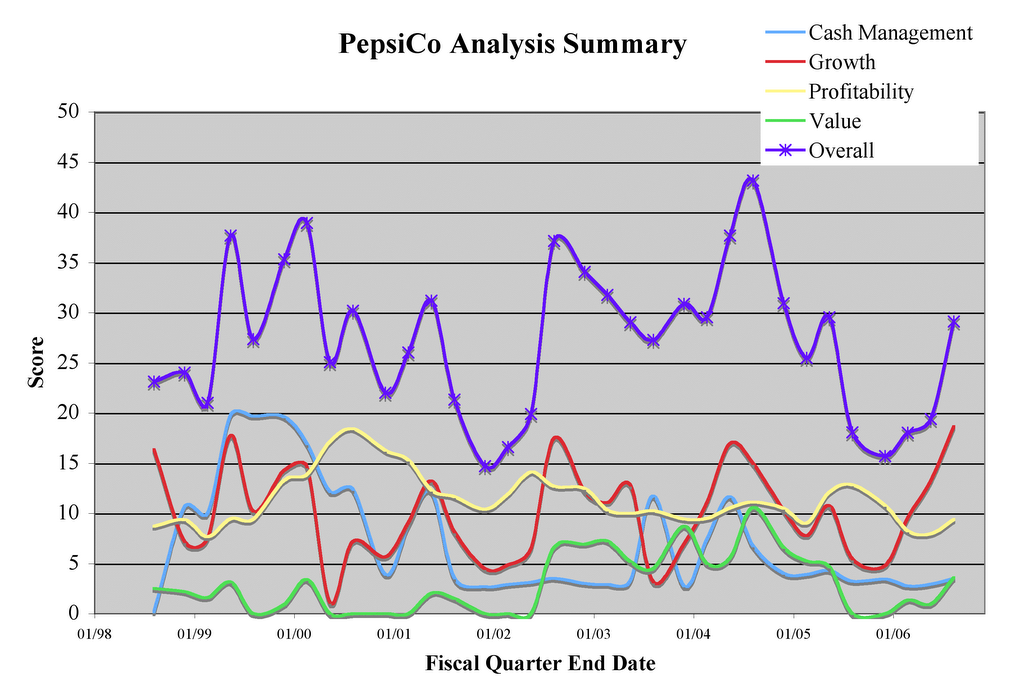
These gauge scores translate into a tepid Overall score of 29 points out of 100. From the chart below, showing the scores over time, we see that the Overall score bounced due to an increase in Growth. This is all well and good, but without increases in the other scores, we would suggest caution. If the stock price were to drop, which would push up the Value score, we would re-assess to see if the Growth and Value combination presented an appealing scenario for the future.
For PEP, the correlation between the Overall Score and price appreciation over the next 12 months is a rather high 0.68. The financial data that correlated best with price appreciation were Receivables/Revenue, Revenue/Assets, and the Value metrics other than PEG. Interestingly, Revenue Growth shows a strong negative correlation with price appreciation. We see this often and find it difficult to explain.
In this post, we have consolidated the analysis results for PEP. It was performed using financial data through the quarter ending in September 2006.
The Cash Management gauge read a mere 3.5 out of 25 possible points. The Current Ratio was 1.3, which is rather low. We don't consider this to be a problem because the company has long thrived with a low Current Ratio. On the other hand, LTD/Equity at 16 percent is nearly ideal. This debt ratio was higher in previous years, when the company was digesting acquisitions. Inventory levels, as measured by Cost of Goods Sold, stood at 46.2 days. This is in line with historic levels, but we're a little concerned that Inventory increased by 6.5 percent from the year-earlier quarter. The percentage of Inventory that is product ready for sale (i.e., Finished Goods) edged up from its historic average. This bears watching because it might presage a sales slump. Accounts Receivable/Revenues has been increasing. If we knew the Chief Financial Officer, we would ask why.
The Growth gauge displays an excellent 19 of 25 possible points. Year-over-year Revenue Growth was 11.5 percent, and Net Income Growth was an impressive (and accelerating) 27 percent. The Net Income growth was helped by non-recurring taxes in the earlier year. Also impressive was an increase in Revenue/Assets from 101 percent to 108 percent. The growth story was only marred by a 5.2 percent drop in CFO.
The Profitability score was 9 of 25 possible points. The ROIC was 26.4 percent, significantly above the 21.5 percent at the end of the September 2005 quarter. FCF/Equity was a healthy 22.0 percent, but down from the year-earlier 31.3 percent. Operating Expenses/Revenue have edged up in a year from 80.9 percent to 81.3 percent. The expense ratios have been remarkably constant at PepsiCo for many years. The Accrual Ratio was +4.5 percent at the end of the last quarter, compared to -1.6 percent at the end of the year-earlier quarter. This is disappointing on the basis of the absolute value of the Accrual Ratio -- negative value are better than positive -- and its direction.
The Value gauge score was 4 of 25 possible points. The P/E at the end of September was 22.2, which is below the 23.6 median value (suggesting some room for expansion). The current P/E corresponded to 1.42 (42 percent) premium relative to the S&P 500; since this is greater than PEP's 1.28 historical premium, no value points are earned. More promising, the PEG ratio of 22.2/26.8 = 0.83 is indicative of value for a growing company. The Price/Revenue ratio was 3.16, which exceeded its median value of 3.01.
These gauge scores translate into a tepid Overall score of 29 points out of 100. From the chart below, showing the scores over time, we see that the Overall score bounced due to an increase in Growth. This is all well and good, but without increases in the other scores, we would suggest caution. If the stock price were to drop, which would push up the Value score, we would re-assess to see if the Growth and Value combination presented an appealing scenario for the future.
For PEP, the correlation between the Overall Score and price appreciation over the next 12 months is a rather high 0.68. The financial data that correlated best with price appreciation were Receivables/Revenue, Revenue/Assets, and the Value metrics other than PEG. Interestingly, Revenue Growth shows a strong negative correlation with price appreciation. We see this often and find it difficult to explain.
The Overall Gauge
We've separately discussed the four category gauges: Cash Management, Growth, Profitability, and Value. Each gauge displays a score between 0 and 25.
The Overall Gauge score is a weighted average of the category gauge scores, with an adjustment made to scale the result to a range between 0 and 100 points.
The weights are listed below:
The Overall score is:
= 4 * [(sum of (scores * weights)] / (sum of weights)
Because we are very stingy when awarding points, an Overall score, in general, above 50 is decent, 60 is very good, and 70 is excellent. The highest scores we have observed have been in the low 80's.
We also consider a change in the Overall Gauge score to be significant. While a 40-point score is, by itself, mediocre, we would deem a rise from, say, 20 to 40 points to be a favorable outcome.
In weighting the various metrics that drive each category gauge, and in weighting the category gauge scores to compute the Overall Gauge score, we have used heuristics to align the results with future share price appreciation. The highest-weighted scores are those that have historically correlated reasonably well with 12-month share price growth for a variety of companies.
We've seen some good correlation coefficients, as high as 0.8, for some companies, but the correlations are much weaker or even negative for other companies.
In other words, our scores are meaningful for some companies and less so, or not at all, for others. We urge readers to look beyond the rolled-up scores to the individual performance and value metrics and draw their own conclusions.
This post was last modified on 27 June 2009.
04 November 2006
The Value Gauge
- Trailing Price/Earnings
- Trailing Price/Earnings relative to the S&P 500 P/E
- PEG (P/E relative to earnings growth)
- Price/Revenue
- Enterprise Value/Cash Flow
Please note there is an overriding zero-point floor and a five-point ceiling for each score component.
Trailing Price/Earnings
 A company's Price/Earnings
ratio will fluctuate based on investors' assessment of its future
prospects. A sign investors may be undervaluing the company is a P/E
at, or below, the low end of the historic range for that company.
Similarly, higher-than-normal P/E values might be an indication of
excessive optimism among investors.
A company's Price/Earnings
ratio will fluctuate based on investors' assessment of its future
prospects. A sign investors may be undervaluing the company is a P/E
at, or below, the low end of the historic range for that company.
Similarly, higher-than-normal P/E values might be an indication of
excessive optimism among investors.A company gets Trailing P/E value points when its current P/E ratio is less than its median value over the last 16 quarters.
Score = (-10) * [(P/E) / (Median P/E)] + 10
If the P/E is 50 percent of its median value, or less, the company gets 5 points.
Trailing Price/Earnings vs. S&P 500 P/E
 Company-specific news, such as the success or failure of a new product, will understandably lead to swings in the company's Price/Earnings
because it is clear that earnings will grow more or less robustly as a
result. However, changes that affect all companies in an industry or
all companies that operate in a particular market can also significantly
influence future earnings and, therefore, P/E ratios.
Company-specific news, such as the success or failure of a new product, will understandably lead to swings in the company's Price/Earnings
because it is clear that earnings will grow more or less robustly as a
result. However, changes that affect all companies in an industry or
all companies that operate in a particular market can also significantly
influence future earnings and, therefore, P/E ratios.For example, rising interest rates tend to slow economic activity, reducing sales and profits, and also cut the present value of future earnings.
Comparing a company's P/E ratio to the P/E ratio of the overall market, as represented by the S&P 500 index, is one way to filter out the broader factors that affect valuations. When a company's P/E is, say, 10 percent higher the S&P P/E, the company's shares are said to trade at a 10 percent premium to the market. Similarly, a company P/E that is only 90 percent of the market P/E represents a 10 percent discount.
A lower-than-normal premium, or a greater-than-normal discount, could be indicative of an undervaluation. We award value points when the ratio of the company's P/E to the market's P/E is less than its median value over the last 16 quarters.
Score = (-10) * [(Current P/E relative to S&P) / (Median P/E relative to S&P)] + 10
If a company's current P/E is 80 percent of the S&P 500's P/E (i.e., a 20 percent discount), but the median ratio is a 10 percent premium, then the score would be:
(-10) * [(0.8) / (1.1)] + 10 = 2.7 points
PEG
 Many investors consider a low PEG, which indicates that the Price/Earnings is modest relative to earnings growth, to be an important sign of undervaluation.
 The PEG ratio is found by dividing the P/E ratio by the earnings growth rate in percent. For example, the PEG would be 1.0 when the P/E is 12 and earnings are growing by 12 percent.
The PEG is especially useful if the denominator is the rate the company's earnings will grow in the future. At GCFR, we're leery of projected earning growth rates, we don't assign any credibility to published five-year forward growth rates.
We've used to the trailing one-year earning growth rate in our PEG calculations, but we have been unsatisfied by the results. One-time gains and losses make the PEG values erratic.
Instead, after much experimentation, we've settled on using the four-year average rate of growth in Operating Profit after Taxes as the earnings growth rate in the PEG calculations.
We award value points when the PEG is low as determined by this equation:
Score = 5 - [4*(PEG-0.75)]
As usual, the score is limited to a range between 0 and five points.
A PEG less than or equal to 0.75 earns the full five points, and PEG ratios greater than 2.0 get none.
Price/Revenue
 A lower-than-normal Price/Revenue
ratio may also be a sign value. For this reason, we give the company
value points when its Price/Revenue ratio is less than its median value
over the previous 16 quarters.
A lower-than-normal Price/Revenue
ratio may also be a sign value. For this reason, we give the company
value points when its Price/Revenue ratio is less than its median value
over the previous 16 quarters.Score = (-10) * [(Price/Revenue / (Median Price/Revenue)] + 10
If the Price/Revenue is 50 percent of its median value, or less, the company gets 5 points.
Enterprise Value/Cash Flow
Enterprise Value/Cash Flow is similar to Price/Cash Flow from Operations, but it substitutes Enterprise Value for Market Value.
Enterprise Value is Market Value, plus Debt (long- and short-term), minus the company's Cash and Short-term Investments. EV is considered a better estimate of the cost to a corporate acquirer than the Market Value because the acquirer is assuming the debt, less any cash on hand that can be used to pay off the debt.
We give the company value points when its EV/CFO ratio is less than its median value over the previous 16 quarters.
Score = (-20) * [(EV/CFO / Median EV/CFO)] + 20
The five-point maximum score is attained when the EV/CFO ratio is 75 percent or less than its median value.
We use the following weights for the different Value score components.
- Trailing Price/Earnings (30)
- Trailing Price/Earnings relative to the S&P 500 P/E (15)
- PEG (5)
- Price/Revenue (35)
- Enterprise Value/Cash Flow (15)
The Value score is 5 * (the sum of each component's score multiplied by its weight) / (100, the total of the weights).
Note: This post was last updated on 1 August 2010.
02 November 2006
The Profitability Gauge
 The Profitability gauge score depends on the current and past values for the following quantities:
The Income Statement has the greatest effect on the Profitability gauge, but data from the Balance Sheet and the Cash Flow Statement are also employed.
The Profitability gauge is determined by calculating a score for each of the four quantities listed above. A weighted average of the scores is scaled to set its minimum value at zero and its maximum value at 25 points.
We're tough graders: it's rare for a company to achieve a 25-point Profitability score.
The scoring details are described below. Please note there is an overriding zero-point floor and a five-point ceiling for each ratio.
Operating Expenses/Revenue Score
 We give points for reducing the Operating Expenses/Revenue ratio over the course of a year.
Score = (50)*(decrease in Operating Expenses / Revenue),
The ratio is expressed as a decimal. An increase in the ratio from one year to the next automatically gets zero points.
The five-point maximum is obtained when the reduction is 10 percent: (50) * (0.1) = 5.
In our sample Income Statement, GCFR Inc.'s ratio of Operating Expenses / Revenue decreased from 25.2 percent to 24.7 percent. This 0.5 percent decrease would earn (50) * (0.005) = 0.25 points.
Return on Invested Capital Score
 There are two components to the ROIC score. The first component, which we cap at 4 points, is:
Score = 16 * ROIC
The ROIC is expressed as a decimal. Note that the four-point limit is hit when ROIC hits 25 percent (0.25).
The second component is a one-point bonus that is awarded only if the ROIC for the last four quarters exceeds the ROIC for the four previous quarters.
In our sample Income Statement, GCFR Inc.'s ROIC was 8.8 percent. This performance merits 1.4 points (16 * 0.088), with the possibility of one-point bonus.
FCF/Invested Capital Score
 There are two components to the Free Cash Flow/Invested Capital score. The first component, which we cap at 4 points, is:
= 16 * (FCF/Invested Capital)
Note that the four-point limit is hit when FCF/Invested Capital hits 25 percent (16) * (0.25) = 4.
The second component is a one-point bonus when the FCF/Invested Capital for the last four quarters exceeds the FCF/Invested Capital for the four previous quarters.
In our sample Cash Flow Statement, GCFR Inc's FCF/Equity was 12.7 percent. This performance merits 2.0 points (16 * 0.127), with the possibility of one-point bonus.
Accrual Ratio Score
 Recall that the Accrual Ratio is proportional to the difference between Net Income and CFO.
A negative Accrual Ratio indicates that CFO exceeds Net Income, which
is suggestive of high-quality, operations-driven earnings.
Recall that the Accrual Ratio is proportional to the difference between Net Income and CFO.
A negative Accrual Ratio indicates that CFO exceeds Net Income, which
is suggestive of high-quality, operations-driven earnings.Our score for the Accrual Ratio has two components: the first is proportional to the ratio's value, and the second is proportional to the ratio's change from the previous year.
The first component of this score, worth 2.5 points, is determined by the following equation:
Score = 0, if the Accrual Ratio is positive
= (-50) * Accrual Ratio, if the Accrual Ratio is negative.
The 2.5-point cap is hit when the Accrual Ratio is -5.0 percent or lower.
The second component of this score, worth another 2.5 points, is determined by this equation:
Score = 0, if the Accrual Ratio is higher than it was one year ago
=50 * (decrease in Accrual Ratio), if the Accrual Ratio has dropped
If the Accrual Ratio dropped from -0.5 percent to -1.2 percent, the score would be:
(-50)*(-0.012) + (50)*(0.007) = 0.95 points.
Determining the Profitability Score
We use the following weights for the different Profitability score components.
- Operating Expenses / Revenue Score (27.5)
- ROIC Score (32.5)
- FCF/Invested Capital (27.5)
- Accrual Ratio Score (12.5)
The Profitability score is 5 * (the sum of each ratio's score multiplied by its weight) / (100, the total of the weights).
Note: This post was last updated on 1 August 2010.
31 October 2006
The Growth Gauge

The Growth gauge score depends on the rate at which the company has increased the following quantities:
The Income Statement has the greatest effect on the Growth gauge, but data from the Balance Sheet and the Cash Flow Statement are also employed.
The Growth gauge is determined by calculating a score for each of the five quantities listed above. A weighted average of the scores is then scaled to set the minimum value at zero and the maximum value at 25 points.
We're tough graders: it's rare for a company to achieve a 25-point Growth score.
The scoring details are described below. Please note there is an overriding zero-point floor and a five-point ceiling for each growth component.
Revenue Growth
Using the quarterly Revenue figures on eight sequential Income Statements, the Revenue growth rate is found comparing Revenue in the last four quarters to Revenue in the four previous quarters.
1. If Revenue growth is negative (i.e., Revenue was less in the last four quarters), the score is zero points.
2.
If the growth rate exceeds 5 percent, then 0.15 points are given for
each percentage point above 5 percent, up to a total of 3 points. A
growth rate of 25 percent or higher would earn all 3 points. [0.15 *
(25 - 5)]= 3.
3. If the growth rate exceeds its four-year average, a bonus point is earned.
4. If the growth rate is greater than it was one year earlier, a bonus point is earned.
5.
If the latest growth rate exceeds the growth rate calculated after each
of the three previous quarters, a bonus point is earned.
6. The rules above could produce a score as great as 6 points. If the score is greater than five, it is reduced to five points.
Revenue/Assets Growth

For
each percentage point that the Revenue/Assets ratio is higher than it
was one year earlier, up to five percentage points, a point is awarded.
Revenue/Assets is found by dividing the Revenue in the last four quarters by the average Total Assets over these four quarters. It is expressed as percent.
This score rewards companies that grow their Revenue faster than they increase their Assets.
No points are given if Revenue/Assets is declining or if there was no Revenue growth.
If,
for example, Revenue/Assets increased from 83.2 percent to 85.5
percent, the score would be 3.3 points as long as Revenue also increased
from the previous year.
The
Operating Profit growth rate is the average 12-month rate of increase,
over the last 16 quarters, of Operating Profit after Taxes.
1. If Operating Profit growth is negative (i.e., Operating Profit is declining), the score is zero points.
2.
If the growth rate is positive, then the score is 20 * Operating Profit
growth rate (as a decimal), up to a total of 4 points. A growth rate
of 20 percent or higher would earn all 4 points. [20 * (0.2)]= 4.
3. If the latest Operating Profit growth rate exceeds the growth rate calculated one year earlier, a bonus point is earned.
Net Income Growth
The
Net Income growth rate is found by comparing Net Income in the most
recent four quarters to Net Income in the four previous quarters.
1. If Net Income growth is negative (i.e., Net Income is declining), the score is zero points.
2.
If the growth rate is positive, then the score is 20 * Net Income
growth rate (as a decimal), up to a total of 4 points. A growth rate of
20 percent or higher would earn all 4 points. [20 * (0.2)]= 4.
3.
If the latest Net Income growth rate exceeds the growth rate calculated
after each of the three previous quarters, a bonus point is earned.
Cash Flow from Operations Growth
The CFO growth rate is found by comparing CFO in the most recent four quarters to CFO in the four previous quarters.
1. If CFO growth is negative (i.e., CFO is declining), the score is zero points.
2.
If the growth rate is positive, then the score is 20 * CFO growth rate
(as a decimal), up to a total of 4 points. A growth rate of 20 percent
or higher would earn all 4 points. [20 * (0.2)]= 4.
3.
If the latest CFO growth rate exceeds the growth rate calculated after
each of the three previous quarters, a bonus point is earned.
Determining the Growth Score
We use the following weights for the different Growth score components:
- Revenue Growth (10)
- Revenue/Assets (35)
- Operating Profit Average Growth (10)
- Net Income Growth (25)
- Cash Flow from Operations (20)
This post was last modified on 30 July 2010.
29 October 2006
The Cash Management Gauge
Most of the data required to compute the ratios are drawn from the Balance Sheet, but some figures from the Income Statement and the Cash Flow Statement are also used.
The Cash Management gauge is determined by calculating a score for each of the eight items listed above. A weighted average of the scores is scaled to set its minimum value at zero and its maximum value at 25 points.
We're tough graders: it's a rare company that will achieve a 25-point Cash Management score.
The scoring details are described below. Please note there is an overriding zero-point floor and a five-point ceiling for each ratio.
Current Ratio
 Score = 5 - 2.5 * (Current Ratio - 2.5) ^ 2
In our sample Balance Sheet, GCFR Corp. had a Current Ratio was 75/41 = 1.83. It would earn 3.9 points.
The maximum score of 5 is attained when the Current Ratio = 2.5. Points are deducted for higher Current Ratios, which might seem strange, because the company is building its bank account instead of putting its assets to work.
LTD/Equity
 Score = 5.0 - 20*(LTD/Equity -0.2)^2
In our sample Balance Sheet, GCFR Corp. had an LTD-to-Equity ratio of 60/134 = 44.8 percent. It would earn 3.8 points.
The maximum score of 5 is attained when Long Term Debt to Equity equals 20 percent. The equation is constructed such that a company with an LTD/Equity ratio between 0 and 40 percent will get at least 4 out of the 5 possible points. We think some debt is appropriate because it gives stockholders leverage, but we disapprove of excessive debt.
Score = (-1.5) * Debt/CFO + 5.25
Debt/CFO is measured in years.
A bonus point is awarded if Debt/CFO is lower that it was one year earlier.
In our sample Balance Sheet, GCFR Corp. had a Debt-to-CFO ratio of 16.6 months = 1.38 years. It would earn 3.2 points.
Debt/CFO is measured in years.
A bonus point is awarded if Debt/CFO is lower that it was one year earlier.
In our sample Balance Sheet, GCFR Corp. had a Debt-to-CFO ratio of 16.6 months = 1.38 years. It would earn 3.2 points.
Inventory/CGS
 Score = 25 * (delta Inventory-to-CGS / Inventory-to-CGS one year earlier)
Inventory-to-CGS is measured in days.
A 20 percent (i.e., 0.2) reduction in the number of Inventory days will achieve the full five points (25 * 0.2).
In our sample Balance Sheet, GCFR Corp. had a Inventory/CGS ratio = $13/0.433 = 30 days. It the ratio was 33 days one-year earlier, then the percent reduction would 3/33 = 0.091. It would earn 2.8 points.
We don't use this ratio if inventory isn't significant for the company (e.g., the company sells a service, not a product).
Finished Goods/Inventory
 Score = 200 * (decrease in the Finished Goods ratio from its median value)
If the current percentage of inventory made up of finished goods is above this ratio's median value, no points are earned.
A company gets the full 5 points if the current value of the finished good ratio is 2.5 or more percent less than its median value.
We don't use this ratio for scoring if the company's inventory doesn't consist of varying mix of raw materials, work in process, and finished goods (e.g., the company is a retailer), or if inventory isn't significant for the company (e.g., the company sells a service, not a product).
For example, let's say the finished goods component of inventory (the rest being raw materials and work in process) is now 28 percent and that the median value for this ratio is 30 percent. The 2-percent reduction, worth 4 points, suggests that the company's sales were greater than expected. The opposite, an increase in finished good inventory, is worrisome.
Days of Sales Outstanding
 Score = 25 * (delta DSO / DSO one year earlier)
A 20 percent (i.e., 0.2) reduction in DSO is needed to earn the full five points (25 * 0.2). Lesser reductions will get lower scores. The score will be zero if there is no reduction.
For example, if GCFR Corp.'s Balance Sheet shows that Accounts Receivable averaged $12 million over the last year, and if its Revenue during the year was $200 million, then Receivables were 0.06 of annual Revenues, which is 21.9 days of Revenue. If last year's figure was 23.9 days, then the score would be 25 * (2/23.9) = 2.1 points.
Working Capital/Revenue
Score = ((-8.75) * WorkingCapToRevenue) + 3.5

Negative Working Capital results in a 3.5-point score.
1.5 bonus points are awarded if the ratio is lower that it was one year earlier.
The maximum score would be earned when Working Capital is negative and has become less as a percentage of Revenue.
In our sample Balance Sheet, GCFR Corp. had Working Capital of $75 million minus $41 million = $34 million on 30 June 2006. During the previous year, the GCFR Income Statement lists Net Income of $20.1 million Therefore, the Working Capital to Revenue ratio equals 34/20.1= 1.7, and no points would be awarded with the possible exception of the bonus 1.5 points.
Cash Conversion Cycle Time
Score = (1/2) * (percent decrease in CCCT from last year)
No score is allowed to be less than zero or greater than five.
In other words, each two percent decrease in CCCT earns another score point.
In our sample Balance Sheet, GCFR Corp. had a CCCT of 37 days. If this parameter had been 40 days one year earlier, then it decreased by 3/40 = .075 (7.5 percent). This would earn 7.5/2 = 3.75 points.
Determining the Cash Management Score
We don't simply add up the scores described above to calculate the Cash Management score. We believe some ratios are more significant than others. To be specific, we use the following weights:
- Current Ratio (15)
- LTD/Equity (5)
- Debt/CFO (7.5)
- Inventory/CGS (15)
- Finished Goods/Inventory (15)
- Days of Sales Outstanding (10)
- Working Capital/Revenue (7.5)
- Cash Conversion Cycle Time (7.5)
The Cash Management score is 5 * (the sum of each ratio's score multiplied by its weight) / (100, the total of the weights).
This post was last modified on 5 February 2010
Subscribe to:
Posts (Atom)


