In this post, we have consolidated the analysis results for PEP. It was performed using financial data through the quarter ending in September 2006.
The Cash Management gauge read a mere 3.5 out of 25 possible points. The Current Ratio was 1.3, which is rather low. We don't consider this to be a problem because the company has long thrived with a low Current Ratio. On the other hand, LTD/Equity at 16 percent is nearly ideal. This debt ratio was higher in previous years, when the company was digesting acquisitions. Inventory levels, as measured by Cost of Goods Sold, stood at 46.2 days. This is in line with historic levels, but we're a little concerned that Inventory increased by 6.5 percent from the year-earlier quarter. The percentage of Inventory that is product ready for sale (i.e., Finished Goods) edged up from its historic average. This bears watching because it might presage a sales slump. Accounts Receivable/Revenues has been increasing. If we knew the Chief Financial Officer, we would ask why.
The Growth gauge displays an excellent 19 of 25 possible points. Year-over-year Revenue Growth was 11.5 percent, and Net Income Growth was an impressive (and accelerating) 27 percent. The Net Income growth was helped by non-recurring taxes in the earlier year. Also impressive was an increase in Revenue/Assets from 101 percent to 108 percent. The growth story was only marred by a 5.2 percent drop in CFO.
The Profitability score was 9 of 25 possible points. The ROIC was 26.4 percent, significantly above the 21.5 percent at the end of the September 2005 quarter. FCF/Equity was a healthy 22.0 percent, but down from the year-earlier 31.3 percent. Operating Expenses/Revenue have edged up in a year from 80.9 percent to 81.3 percent. The expense ratios have been remarkably constant at PepsiCo for many years. The Accrual Ratio was +4.5 percent at the end of the last quarter, compared to -1.6 percent at the end of the year-earlier quarter. This is disappointing on the basis of the absolute value of the Accrual Ratio -- negative value are better than positive -- and its direction.
The Value gauge score was 4 of 25 possible points. The P/E at the end of September was 22.2, which is below the 23.6 median value (suggesting some room for expansion). The current P/E corresponded to 1.42 (42 percent) premium relative to the S&P 500; since this is greater than PEP's 1.28 historical premium, no value points are earned. More promising, the PEG ratio of 22.2/26.8 = 0.83 is indicative of value for a growing company. The Price/Revenue ratio was 3.16, which exceeded its median value of 3.01.
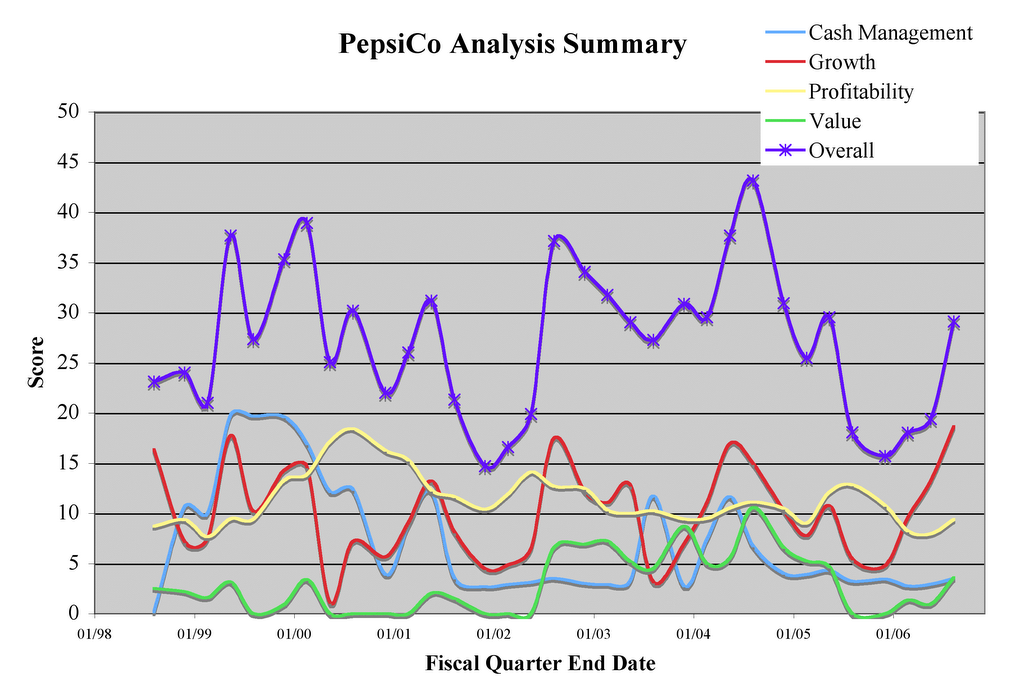
These gauge scores translate into a tepid Overall score of 29 points out of 100. From the chart below, showing the scores over time, we see that the Overall score bounced due to an increase in Growth. This is all well and good, but without increases in the other scores, we would suggest caution. If the stock price were to drop, which would push up the Value score, we would re-assess to see if the Growth and Value combination presented an appealing scenario for the future.
For PEP, the correlation between the Overall Score and price appreciation over the next 12 months is a rather high 0.68. The financial data that correlated best with price appreciation were Receivables/Revenue, Revenue/Assets, and the Value metrics other than PEG. Interestingly, Revenue Growth shows a strong negative correlation with price appreciation. We see this often and find it difficult to explain.


No comments:
Post a Comment