28 April 2007

TDW: Conference Call of 26 April

Tidewater management conducted a conference call with members of the financial community after reporting earnings for the quarter and fiscal year that ended on 31 March. The discussion didn't change our analysis, but the future guidance was informative. (Some apparent voice-to-text glitches add comic relief.)

The company made the following points:
  • The utilization rates for deep-water vessels was in the high 90% range
  • Dayrates for the fleet were higher by almost 22%
  • The fleet has been updated: 109 new vessels
  • If gains on asset sales are excluded, the year-on-year earnings gain was 87.4%
  • There were two fewer revenue days in the March 2007 quarter than the December 2006 quarter
  • The estimated tax rate for the current year is 19 percent, lower than the period just concluded by 2 percent
  • 83% of revenues in the last quarter came from international activities
  • The Gulf of Mexico is no longer the company's operational focus
  • 22 of 35 vessels under construction will be delivered in fiscal 2008
  • $237 million will be paid in fiscal 2008 for new vessels; current cash balances cover this easily.
  • Management is aware that analysts (including us) are wondering how the large amount of cash on hand, and flowing in from operations, will be deployed: acquisitions? dividend increases? share repurchases?

27 April 2007

MSFT: Analysis through March 2007

Microsoft (MSFT), the developer of operating system and application software, recently submitted a 10-Q for the quarter ending on 31 March 2007. This post reports on our analysis of those results.

The quarter included the long-delayed release in late January of the Vista operating system to consumers. Microsoft stock, after years of stagnant performance, rallied in anticipation of the release. Share repurchases also added lift. However, the gains, at least in part, proved to be ephemeral. The shares reversed course after Steve Ballmer threw cold water on the most optimistic expectations. An order to pay $1.5 billion to Alcatel-Lucent for infringing on digital music technology probably didn't help.

When we analyzed Microsoft after the results from December 2006 became available, the Overall score was a modest 37 points. Of the four individual gauges that fed into this composite result, Growth was the strongest at 11 points. Value was weakest at 8 points.

With the available data from the most recent quarter, our gauges now display the following scores:

Cash Management. This gauge has been stuck at 9 points for the last 10 quarters. The Current Ratio is now a solid 2.0. It has come down from previous unnecessarily high levels. Long-Term Debt/Equity is, as always, negligible. Inventory/Cost of Goods Sold rose to 67 days from 66 days at the end of December. The percentage of Inventory that is product ready for sale (i.e., Finished Goods) is 76 percent, compared to 83 percent in December. If the Finished Goods ratio is meaningful, and we're not sure it is for a software firm, it suggests that product demand was a little higher than expected. Maybe it says something about X-box sales. Accounts Receivable/Revenues equal 62 days. This is higher than the 58-day average for the company. We suspect this change is more related to the revamped product line, rather than the company's ability to get customers to pay their bills.

Growth. This gauge increased 7 points from December's 11 points. Revenue growth is now 16 percent year over year, with revenues accelerating in the last quarter, up from 10 percent a year ago. Net Income growth is a surprisingly weak 3 percent, down from 20 percent a year ago. The increase was slowed by a change in the income tax rate from 25 to 31 percent. CFO growth is a tepid 10 percent, up from 6 percent a year ago. Revenue/Assets surged to 78 percent. The increase indicates that the company is becoming more efficient at generating sales. The asset reduction caused by massive share repurchases, $13 billion in the last six months of 2006, might be a non-operational explanation for the increase.

Profitability. This gauge increased 2 points from 10 points in December. ROIC grew to an impressive 46 percent from 31 percent a year ago. It reached its highest level since 2001. FCF/Equity jumped up to 41 percent, its highest value since 1999, from 34 percent. Operating Expenses/Revenue stayed at 63 percent, which is the same percentage it was a year ago. Lower SG&A expenses offset a decline of a few percent in Gross Margin. The Accrual Ratio, which we like to be both negative and declining, didn't change from the -1 percent value of March 2006. This tells us that the contributions of cash flow and balance sheet accruals to Net Income remained the same.

Value. Microsoft's stock price fell over the course of the quarter from $29.86 to $27.87. The Value gauge, based on the latter price, increased to a 11 points, compared to 8 points three months ago, but down from 17 points twelve months ago, respectively. The P/E at the end of the quarter was 20, down a little from recent quarters (and down a lot from the historical average over 30). The average P/E for the Software and Programming industry is a more expensive 32. To remove the effect of overall market changes on the P/E, we note that the company's current P/E is at a 24 percent premium to the average P/E, using core-operating earnings, for stocks in the S&P 500. In the last couple of years, the premium has compressed from much higher levels. Companies tend to trade at a premium when their growth rates are greater than average, particularly when the growth rates seem more likely to be sustained. The PEG ratio of 7 is indicative of a very expensive stock, but will come down once earnings growth is realized. The Price/Revenue ratio, which is less affected by the one-time factors that cause wide swings in earnings, has declined to about 5.5. The average Price/Sales for the Software and Programming industry is 6.


Now at a solid, but unspectacular, 48 out of 100 possible points, the Overall gauge bounced back from December's 37-point low. There were great signs of growth in the most recent quarter, and we will be waiting to see how much it reaches the bottom line.

21 April 2007

The Week Ahead

Briefing.com lists over 500 -- we counted 517 -- companies expected to report earnings this week. The directory includes five companies that have been analyzed in GCFR: BUD, COP, PEP, MSFT, and TDW.

When the reports are received for each of these five companies, we will analyze the financial statements and compute new scores for our gauges. The updated scores with some commentary will be posted here as quickly as possible.

We have already provided a look-ahead to TDW's results. Time doesn't permit the same level of predictive analysis for the other companies, but we can offer today a few words about a few of the companies.

PEP: PepsiCo's finances exhibit less volatility than most of the other companies we follow. Inventory, debt, receivables, etc., are kept under control and don't deviate too much from quarter to quarter. Inventory levels in March tend to be a little higher than in December, so Inventory/CGS might have been about 47 days when the first quarter concluded. Year-over-year revenue growth slowed to 8 percent in December from the 11 to 12 percent range. If revenues bounce back a percentage point or two, we could dismiss ideas that December's results were the beginning of a slide. After a flat spell in late 2005 and early 2006, Net Income took off in late 2006. Income in 2005 was depressed, in part, by huge income taxes on repatriated international earnings. The increases in Net Income were not matched by increases in CFO. By our reckoning Free Cash Flow was down in 2006 relative to the prior year. Strong positive cash flow growth would be a good sign.

COP: It has been a year since the acquisition of Burlington Resources, so we will be looking to see if efficiencies have been realized. We will also look for continued actions to firm up of the balance sheet in the aftermath of the acquisition. Accounts Receivables spiked up in the fourth quarter, and we will check to see whether that move was an anomaly. More significantly, we will determine whether the decelerating growth in Revenue, Net Income, and Cash Flow has been reversed.

MSFT: We'll be looking to see how much January's launch of Vista increased revenues and earnings. Revenue growth has been around 11 percent per year. Net Income and CFO were 9 and 10 percent lower, respectively, in 2006 than 2005. New product sales should juice earnings and cash flow, but how much was spent on advertising?

19 April 2007

NOK: Financial Analysis through March 2007

Nokia (NOK), headquartered in Espoo, Finland, is a global seller of cellular phones and the equipment for mobile phone networks.

Nokia once held a commanding, and quite rewarding, position in the mobile phone market. However, the marketplace changed, and the popularity of different cell phone designs began to move up and down like hemlines. Nokia's products fell out of favor, compared to the Razr-powered Motorola, and its profits fell commensurately. Now, there is some evidence that the fortunes of these competitors has reversed again. Challenges remain, however, including an increasingly intense battle with Qualcomm over patents.

Readers should be aware of some facts about Nokia's financial reporting that distinguish it from companies based in the U.S. First, the financial statements are prepared in accordance with International Accounting Standards (IAS), rather than U.S. Generally Accepted Accounting Principles (GAAP). Fortunately, IAS and GAAP are similar enough that we can easily apply our analytical methodology. Second, the Euro is the currency used in Nokia's financial statements. Third, Nokia isn't required to file 10-Q reports with the SEC. Instead, they issue detailed press releases, each of which gets submitted to the SEC under a Form 6-K (Current Report of Foreign Issuer) cover letter.

When we last analyzed Nokia, after the results from December 2006 became available, the Overall score was a solid (and improving) 45 points. Of the four individual gauges that fed into this composite result, Growth was the strongest at 20 points. Value was weakest at 7 points.

We have updated the analysis to address Nokia's financial results for the first quarter of 2007. Some key ratios are listed below. Except for the first item, the cost and revenue figures are trailing-four-quarters values.

  • Revenue growth qtr to yr earlier qtr
4%
  • Revenue growth year on year
14%
  • Gross margin/Revenue
32%
  • Operating expenses/Revenue
87%
  • R&D/Revenue
9%
  • Sales,G&A/Revenue
10%
  • Operating profit growth year on year
15%
  • Net income growth year on year
11%
  • Revenue/Total assets
182%
  • Return on Invested Capital (trailing yr)
44%
  • Inventory/Cost of revenue (days)
21
  • Long-term debt/Stockholders' equity
0.5%
  • CFO growth year on year
37%
  • FCF/Equity
37%


After processing these and quite a few other data points and ratios, our gauges now display the following scores:

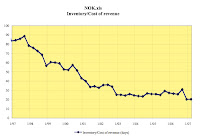
Cash Management. This gauge dropped 2 points from 16 to 14. The Current Ratio is now 1.86. It has been inching up, ever so slowly, and we would be happy to see this continue. Long-Term Debt/Equity is an inconsequential 1 percent. The debt ratio has been between 0 and 2 percent since September 2000. Inventory/Cost of Goods Sold is unchanged from December at 20.5 days, and the inventory level is now significantly leaner than last year's 27 days. Unfortunately, Nokia does not identify the proportion of inventory made up of Finished Goods; the missing information would give us more insight. Accounts Receivable/Revenues is now 51 days, which is at the lower end of its normal range. In other words, the company is not finding it more difficult to get paid by its customers.
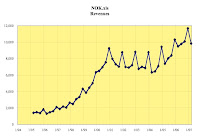
Growth. This gauge maintained the excellent 20 point score achieved in December. Revenue growth, however, slipped to 14 percent year over year from 19 percent a year ago. Net Income growth similarly slowed to a modest 11 percent from last year's 14 percent. It should be noted that Net Income in the current period benefited from a 2 change in the income tax rate from 26 to 24 percent. A powerful 37 percent CFO increase could be viewed as outweighing the slower growth in Revenue and Net Income; to be sure, last year's weak CFO made the comparison easier. Revenue/Assets is 182 percent; this ratio jumped up into the 180's last June. The company evidently took some action (asset-reducing stock buyback?) to become more efficient at generating sales.
Profitability. This gauge increased 3 points from the prior quarter. One might have thought that the previous year's 40 percent ROIC couldn't be topped. However, ROIC grew to an even more impressive 44 percent. Similarly, FCF/Equity jumped to 37 percent from 30 percent. Operating Expenses/Revenue were kept under control, increasing only from 86 percent to 87 percent. A 2 percent decrease in Gross Margin (34 to 32 percent) was essentially balanced by an equivalent reduction in R&D/Revenue (11 to 9 percent). The Accrual Ratio, which is ideally both negative and declining, moved in the right direction from +3 percent to -1 percent. The 4 percent delta is very good, and it tells us that more of the company's Net Income is due to cash flow (rather than non-operational balance sheet accruals).

Value. Over the course of the quarter, Nokia's stock price increased from $20.32 to $22.92. The Value gauge, based on the latter price, is on life support at 1 point. Is the solid operational performance described above already reflected, and then some, in the stock price? The trailing P/E at the end of the quarter was 21.5, which is pretty much its long-term median value. (With our value mindset, points are given only when the share price has become less expensive). We should note that the average P/E for the Communications Equipment industry is a more expensive 25. To remove the effect of overall market changes on the P/E, we found that the company's current P/E is at a 33 premium to the average P/E, using core operating earnings, for stocks in the S&P 500. Historically, the premium has been closer to 25 percent. Do prospects for earnings growth faster than the average company justify the expanding premium? The PEG ratio of 1.88 isn't signaling a bargain. The Price/Revenue ratio, now at 2.2, has been stable at around that level. The average Price/Sales for the industry is 5.35.


Now at a so-so 35 out of 100 possible points, the Overall gauge has been weak since 2003. If we didn't overweight Value relative to the other gauges, the score would have been much, much better. Maybe this is why the stock market greeted the latest earnings report so favorably, or maybe it was the optimistic view of the future. We would be tempted to put Nokia aside for a while, but reconsider it the next time a market drop pushes down valuations.

15 April 2007

INTC: What to look for Tuesday

On Tuesday, semiconductor manufacturer Intel (INTC) will report its earnings for quarter ending 31 March 2007. In this post, we will identify the data we will check first to determine how well the company performed. We lack sufficient information to estimate how the first quarter results will change Intel's scores on our gauges, but we will address the factors that will move the scores the most.

We will publish a full analysis, with updated gauges, as soon as practical after Intel issues their report.

But, first, some background.

We saw little to foretell a recovery, after a Worst-in-the-Dow 2006, when we analyzed Intel's financial results, through December of that year. The share price continued to decline in the first quarter of 2007, from $20.25 to $19.13, but it is now back over $20.00. Recent improvements might be due favorable reviews given to Intel's newest products and predictions that Intel will regain market share from steadfast competitor Advanced Micro Devices (AMD).

Revenue. Intel's sales dropped in 2006 from $38.8 billion to $35.4 billion. Yes, revenues in the final two quarters of 2006 were greater than in the first two quarters, but this is almost always the case. If anything, the comparisons with 2005 worsened over the course of the year. For the first quarter of 2007, we're assuming, with little conviction, revenues of $9.27 billion. [The Wall Street estimate is $9.01 billion, but the predictions vary from $8.7 to $9.5 billion. This seems like a wide range for such a highly followed company] Our estimate would represent a 4 percent increase over the first quarter of 2006, but it would also translate into a 7 percent decline based on year-over-year comparisons. We chose the value we did with the thought that 2006's 9 percent year-over-year decline might have been the bottom, given Intel's improved competitive standing.

Operating expenses. Intel's gross margin declined from percent values in the upper 50's to below 50 as it fought for market share with AMD. We're looking for 51 percent in the latest quarter, which would translate into a cost of sales of $4.54 billion if the revenue estimate above were to be achieved. We will view a gross margin at, or above, our 51 percent estimate as a key sign of a turnaround.

Intel has not cut R&D and SG&A expenses to match the revenue decline. They probably feel that they have to continue to spend to beat back AMD's challenge. We've assumed 16 percent and 17 percent, respectively, of revenues for these two operating expenses. Given our revenue estimate, these percentages would translate into expenses of $1.48 and $1.58 billion.

Intel always seems to have other operating charges related the amortization of acquisition-related expenses, and, last year, there were big charges for restructuring and asset impairment. We have no visibility into what these expenses might be in 2007. Some companies try to get non-recurring "special" operating charges over all at once, so perhaps the worst is over. We're assuming $80 million of these expenses in the first quarter, which is about the average of the last 10 quarters.

Using the aforementioned estimates for revenue and operating expenses, we calculate a predicted operating income of $1.59 billion.

Other income. Net interest and other income had been running around $150 million per quarter, before jumping markedly in the last two quarters of 2006. The footnotes to the financial statements indicate that this was due to gains of $612 million from three completed divestitures. We will assume that the divestitures are over and, therefore, that $150 is a reasonable estimate for net income and other income in the first quarter. We're also assuming no gains on equity securities.

These assumptions lead to an income before taxes estimate of $1.74 billion.

Net income. The income tax rate has average about 30 percent, which would result in net income of $1.22 billion ($0.21 per share). The professional analysts are assuming $0.22 per share, give or take a couple of cents. [We're not sure which, if any, non-recurring gains and losses are built into the Street estimate. One has to be very careful using published EPS values.] In the year-earlier quarter, net income was $1.36 billion ($0.23 per share).

Valuation. To assess value, in keeping with our normal practice, we're using the 31 March stock price of $19.13. Taking the estimated net income for the first quarter of 2007, and combining it with the actual net income for the three previous quarters, the trailing 12-month P/E ratio will be about 23. This a little below the 26 average for the semiconductor industry, but it still constitutes a significant premium relative to the S&P 500. The premium, for a company with declining earnings, suggests optimism for a turnaround. Price/Sales is about 3.2, which is less than the 4.4 industry average. With decreasing earnings, the PEG ratio isn't meaningful.


Balance sheet. We've only written about the income statement to this point. But, given the Intel's recent performance, we view the inventory figures on the balance sheet as critical indicator of the company's financial health. Inventory/CGS was a too-high 92 days at the end of December, compared to 72 days in December 2005. The latter value is closer to the 5-year median. Finished goods were 39 percent of inventory at the end of December, which was the highest percentage of the current decade. Increases in this ratio sometimes indicate that a company's output has gotten ahead of demand.

11 April 2007

ADP: An Aristrocrat?

Jim Cramer, on Mad Money, discussed the S&P 500 Dividend Aristocrats that have steadily increased their payouts. He deemed Automatic Data Processing (ADP) the Top Aristocrat Pick for a number of reasons, including the spin-off of Broadridge (BR), which we have mentioned previously.

We're shelving our previous evaluation of ADP until we can examine the pro-forma financial statements the company made available in conjunction with the spin-off. We want to see whether there is a reasonably complete a financial history for ADP that is representative of the current organization. Since our methodology includes an analysis of financial trends, we can't rely on its results unless there is a valid financial record.

Value Blog Review

Earlier this week, the Value Blog Review made some nice remarks about our web site and methodology. We appreciate the comments.

10 April 2007

Earnings Calendar

As usual, Dow-component Alcoa (AA) kicked off the new earnings season (and with results that exceeded expectations!). This made us wonder when the companies we follow will be reporting their earnings.

Given a stock name or ticker symbol, we found many web sites that will display the release date and the estimated earnings for the company. Briefing.com is one of the better sites with this capability.

However, we wanted to get, in one fell swoop, the dates and earnings for all the companies we analyze. Yahoo!Calendar comes close, if you first create a portfolio in Yahoo!Finance -- and who hasn't? Within the Calendar page, choose Options/Events/Time Guides and allow Financial Events for your portfolios to be displayed. Each day that is scheduled to include an earnings release for a stock in your portfolio will be indicated. Unfortunately, the calendar entry will simply indicate the ticker symbol and the word "Earnings." An estimate for the earnings per share is not provided.

Also, it appears that the Yahoo list isn't as complete as some other services. It doesn't include entries that other sites designate "unconfirmed."

Using Yahoo!Calendar, but filling in its omissions with information from other sources, we have compiled the following list of release dates for the companies that we have previously analyzed.

4/17: INTC
4/19: NOK
4/25: BUD, COP, PEP
4/26: MSFT, TDW
5/1: ADP
5/8: CSCO
5/9: EIX, KG
5/22: HD, WMT

09 April 2007

Earnings Quality

MarketWatch had an interesting article, originally published in the Weekend Wall Street Journal, on earnings quality. It discusses the analytical work of Victor Germack of RateFinancials. We resonate with this firm's philosophy of eschewing buy/sell recommendations in favor of risk analysis and numerical ratings of companies. Their scale runs from 1 to 40, whereas our Overall gauge has limits of 0 and 100 (although very rarely do we see a score over 80).

To gain insight into earnings quality, our methodology gives considerable weight to inventory management. We also use the accrual ratio to see if earnings are driven by ops-driven free cash flow or accounting changes in the balance sheet (i.e., accruals). This approach is based on the ground-breaking work of Richard Sloan.

08 April 2007

New Domain for This Site

If we can pull it off, this web site will move to http://www.financial-gauges.com in a few days.

06 April 2007

TDW: Our Look Ahead

Before we look ahead to TDW's next earning's report, we suggest readers check out a good profile of TDW in Investor's Business Daily.

The scores calculated for each of our gauges were very high when we performed a financial analysis of TDW after the quarter that ended last December. The Overall score was an exceptional 75 points.

We are now anxiously awaiting the results for the quarter that ended on 31 March 2007, which was the fourth quarter of the company's fiscal year 2007. TDW announced that the new results will be reported on 26 April 2007, and the data will be reviewed in a conference call held the same day.

Given the run-up that occurred in TDW's stock price (21.1 percent) during in the first three months of 2007, it will be hard for the company to retain its stellar 20-point mark on the Value gauge. To put it simply, earnings and revenue will have to have grown during this quarter at paces that match or exceed the price increase just to stay even. Since we weight the Value gauge more heavily than the others, the Overall gauge will also be under significant pressure.

Let's put the value concern aside for a moment and speculate about company operations. What might we see in TDW's Income Statement for the most recent quarter when it is released in a few weeks? What would signify a continuation of the company's strong performance, and what would indicate a slowdown?


Revenue. In the early years of this decade, TDW's revenues were essentially stagnant. The first traces of top-line growth were seen in late 2004, revenues accelerate though much of 2005 and 2006. For example, revenue in the June 2006 quarter was 40 percent greater than the June 2005 quarter, which itself was 22 percent greater than the June 2004 quarter. Year-over-year revenue growth hit its maximum in September 2006 at 34 percent. This trailing 12-month growth rate (our preferred metric for growth rates) was still 33 percent at the end of December.

This pace is probably unsustainable -- there aren't (fortunately) major hurricanes every year that lead to extensive off-shore reconstruction and, less dramatically, there is a practical limit on how quickly new ships can be built and deployed -- but there hasn't been any information in the news to suggest that the drop off will be dramatic. Therefore, we think it is reasonable to assume the company's year-over-year revenue growth rate will be at least 28 percent through March 2007. This annual rate would translate into quarterly sales of $291 million and 12-month sales of $1123 million. The average revenue estimate of professional analysts for the quarter is $287 million, so we're a shade more optimistic. [To be honest, we shaved 1 percent off our assumed revenue growth rate when we saw the analyst estimates. There's nothing to be gained by riding too far in front of the herd.]

Gross margin. In the last couple of years, TDW's trailing-year gross margin has increased steadily, from around 36 percent to 53 percent. If, to be conservative, we assume the gross margin in the last quarter will back down a bit to 50 percent, the cost of revenues will be $146 and $530 million, respectively, for the quarter and year ending March 2007. [Note: even with a small assumed gross margin decline in the last quarter, the annual gross margin would still be closer to 53 percent.]

Depreciation. The strong growth in sales has allowed depreciation expenses to edge down to 11 percent of revenue from levels of around 15 percent a couple of years ago. If we assume depreciation will be 12 percent of revenues in the March quarter, the expense will be $35 and $121 million, respectively, for the quarter and year ending March 2007.

Sales, G&A. Similarly, strong sales has cut SG&A expenses from 11 to 9 percent of revenue. If we assume SG&A expenses will be 10 percent of revenue in the last quarter, the figures will be $29 and $102 million, respectively, for the quarter and year ending March 2007.

Operating income. The operating income is found by subtracting the operating expenses (cost of revenues, depreciation, and SG&A, in this case) from revenues. With the assumptions described above, operating income will be $82 and $370 million, respectively, for the quarter and year ending March 2007. This would be exceptional performance because the operating income for the 4 quarters ending in March 2006 was $225 million.

Net Income. To get the bottom-line results, we need to add in other "non-operating" income and subtract provisions for income taxes. We have assumed $10 million for other income in the last quarter -- notionally $5 million for asset sales and $5 million for net interest income. Estimating the tax rate is a more surprising challenge because it has varied widely for TDW. We're going to assume 25 percent for the last quarter, but the annual rate works out to be 22 percent based on tax provisions booked in the three previous quarters.


Rolling up all of the above, we see Net Income at $69 million, or $1.21 per share, for the quarter, up from $1.11 in the year-earlier quarter. We see Net Income at $338 million, or $5.93 per share, for the year, up from $4.04 the previous year. The professional estimates for the recent periods are $1.47 and $5.87. (We haven't yet resolved the incongruity of one value being significantly higher than our estimate and the other being somewhat lower.)

With these estimates, and with the 31 March stock price of $58.58, the P/E ratio would be 9.9, the PEG ratio would be a dirt-cheap 0.22, and Price/Sales would be 3.0. The industry averages, if we mix data from Reuters and Yahoo, are 18.55, 0.6, and 3.6, respectively. These figures suggest that TDW will remain inexpensive relative to its peers.

To estimate the gauge scores, we need to make assumptions about the balance sheet on 31 March 2007 and the cash flow statement for the quarter that ended on that date. For the former, we simply assume that the balance sheet didn't change between December and March. This might be simplistic, but most balance sheet ratios don't vary that much from quarter to quarter unless there was a big acquisition or problems with inventory (which isn't relevant to TDW).

We need to predict two cash flow numbers: the cash flow from operations and capital expenditures. An imperfect assumption for CFO (the correlation coefficient is a bit less than 70 percent) is Net Income plus Depreciation, which we conservatively estimated above at $69 million + $35 million for a total of $104 million. Capital spending has averaged around $48 million per quarter for the last 10 quarters, so we will assume $50 million for this expense in the March 2007 quarter.

With all of these assumptions, we estimate the following scores for TDW for the period ending 31 March 2007:
  • Cash Management: 14
  • Growth: 22
  • Profitability: 14
  • Value: 17
  • Overall: 66

04 April 2007

Some Company News - Part 3

WMT has become somewhat more conciliatory as growth has become harder to achieve. For example, a web site it funded to combat critics has been suspended. Growth will probably have to be generated overseas. It won't come from banking or New York.

WPI has already announced that revenues and earnings this year will be less than Wall Street expectations. Products the company would like to manufacture in Davie, FL, won't receive FDA approval until concerns raised during an inspection of that facility are resolved.

02 April 2007

Some Company News - Part 2

NT sold more than $1 billion of convertible notes. They will use the proceeds to redeem higher yielding bonds that are scheduled to mature next year. Here's the problem: the initial conversion rate is 31.25 common shares per $1,000 principal amount of notes. Therefore, we're looking at the issuance of about 32 million common shares. There are 433.88 million shares outstanding, so the potential dilution is more than 7 percent. (It might be greater: we're not sure how the conversion rate changes over time.) Also, MarketWatch indicates that buyers of these types of notes short the stock. Careful readers of this blog might remember that we previously expressed worries about NT's debt.


PEP continues to perform well, although the stock price seems to have plateaued. Jim Cramer has rejoined the ranks of the PEP supporters. Morningstar recently elevated PEP to its pantheon of 5-star stocks, which they claim trade at a large discount to fair value. We also note that PEP ranked number 30 on BusinessWeek's BW 50 Interactive Scoreboard of companies that are "playing at the top of their game." The only worry might be the amazing appearance of Jones Soda, which seemingly came out of nowhere to snag major retailers as distributors for its beverages sweetened with sugar instead of corn syrup.

TDW closed 2006 at $48.36 per share. It ended the first quarter of 2007 at $58.58 per share. Not too bad for the one company, in our admittedly small analytical universe, that currently scores highly on our gauges. There is rarely any substantial news on this company.