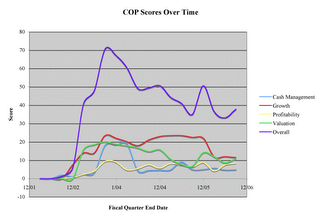
When analyzing Conoco Phillips (COP), we have to accept that the huge merger that formed the company in August 2002 obliterated the utility of the pre-combination financial statements. This was followed in March 2006 by the purchase of Burlington Resources. If we were especially motivated, we could mash together the financial statements for the predecessor companies. However, we would have no way to test the validity of the many assumptions that would be required for this time consuming exercise.
Since four-plus years have passed since its formation, we now have enough data for the 16-quarter median values that we use to put the company's current Price/Earnings and Price/Revenues ratios into a historical context. We need to be aware, however, that our gauges prior to the current period were computed with fewer data points than typical. We also have precious little data about how the Burlington acquisition might alter these values.
We also need to remember that COP's performance is driven, first and foremost, by the price of oil. If the latter rises, COP will look good irrespective of the esoteric ratios to which we give so much attention.
After the 3Q of 2006, the following scores were computed for our analytical gauges:
- Cash Management: 5
- Growth: 12
- Profitability: 8
- Value: 11
- Overall: 38
Because two of our five Cash Management score components, Inventory/CGS and Finished Goods to Total Inventory, don't have the significance they do for a product manufacturer (we like lean inventories for the latter), we have to rely on the other components when evaluating COP. The Current Ratio is 0.9, which might be sufficient, but it's too low to get points in our scoring system. Long-Term Debt/Equity is an ideal 30 percent, suggesting that COP isn't overextended in spite of its merger spree. Receivables are 24.6 days of revenue, up from 22.7 in September 2005, which is not the direction we prefer.
We see very good Growth in Revenue (15%), CFO (27%), and Net Income (31%). However, each of these rates are substantially less than they had been after prior quarters. Revenue/Assets, at 118%, is a concern because it is much less than the rate a year ago. We suspect that the merger with Burlington Resources increased the asset base more than it did revenues.
On the Profitability side, the Accrual Ratio reduction from 9 to 6 percent is a welcome change, but, remember, our ideal is a negative Accrual Ratio (i.e., Cash Flow exceeding Net Income). Return on Invested Capital is a reasonable 13 percent, but it was higher in 2005. FCF/Equity is a little below 7.5 percent, which is just OK. Operating expenses/Revenue at 87% have been coming down, but only by 2% per year.
Assuming a stock price of around $60 per share, the PEG ratio is mere 0.2, indicating that the stock was selling at a huge discount to earnings growth. The P/E itself is a low 6.2, which is about 40 percent of the equivalent figure for the S&P 500. However, it is in-line with historical figures. Price/Revenue is right at its median value of 0.5.
Overall, we see a profitable company with mixed and, in some cases, weakening fundamentals. We see COP strictly as a play on oil prices. If the latter increase, the resulting growth in Net Income would almost certainly be reflected one-for-one into the stock price because it's hard to see the P/E or PEG going any lower.


No comments:
Post a Comment