This post describes our model of Edison International's (NYSE: EIX) Income Statement for the first quarter of 2010, which ended on 31 March.
The purpose of the model is to establish a baseline for identifying surprises, positive or negative, in the quarterly results the company will report on 7 May. Estimates for each line of the Income Statement are derived from management's guidance, the company's historical financial results, and other publicly available data.
We begin by reviewing background information about Edison and the business environment in which it is currently operating. The purpose of the model is to establish a baseline for identifying surprises, positive or negative, in the quarterly results the company will report on 7 May. Estimates for each line of the Income Statement are derived from management's guidance, the company's historical financial results, and other publicly available data.
Edison International is the parent of Southern California Edison and Edison Mission Group.
SCE, which traces its roots back to 1886, is one of the largest investor-owned, regulated electric utilities in the U.S. SCE owns nuclear, hydroelectric, natural gas, and coal electricity generating facilities. It also has transmission systems and a distribution network that brings electricity to commercial and residential consumers in central, coastal and Southern California.
Edison International earned $849 million for its shareholders in 2009 on Revenue of $12.4 billion. In 2008, the company earned $1.2 billion and its Revenue was $14.1 billion.
The other large electric utilities in California are PG&E Corp.'s (NYSE:PCG) Pacific Gas and Electric Company and the San Diego Gas and Electric subsidiary of Sempra Energy (NYSE: SRE).
In accordance with California's Renewables Portfolio Standard, as amended in 2006, regulated utilities in the state have to obtain 20 percent of their energy from renewable sources by the end of this year. In 2008, Governor Schwarzenegger signed an Executive Order requiring that 33 percent of energy sold in 2020 be created from renewable energy sources.
In 2009, renewable energy sources provided about 17 percent (13.6 billion kilowatt hours) of SCE's total power portfolio. Given this figure and its purchase of 65 percent of all the solar power produced in the nation," SCE claims to be "the nation’s leading utility for renewable energy."
We're now ready to look specifically at the March 2010 quarter.
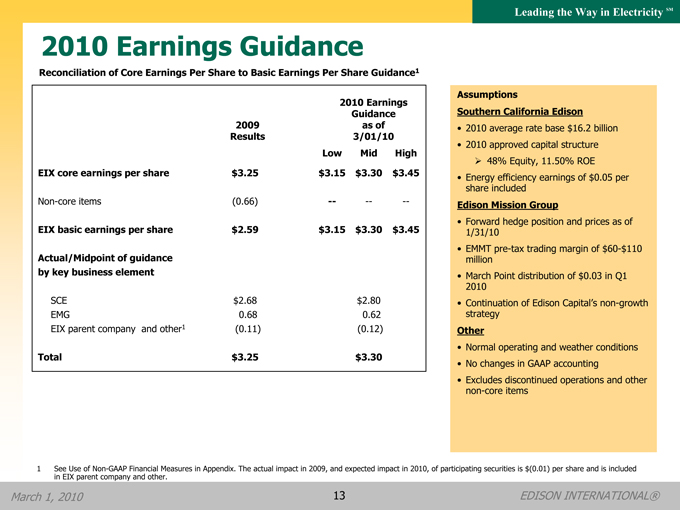 When Edison announced its results for the fourth quarter of 2009, the company indicated it expects "core" earnings in 2010 between $3.15 and $3.45 per share. In 2009, Edison's core earnings were $3.25.
Revenue varies with customer demand for power, the rates it is authorized to charge, and energy prices. Demand is dependent on factors such as the economy, population growth, and weather. For example, electricity demand in Southern California ebbs during mild winters. Edison typically realizes only about 22 percent of annual Revenue during the first quarter of the year.
For convenience, we group the Fuel, Purchased Power, and Other Operation and Maintenance operating expenses reported by Edison and call the subtotal Cost of Goods Sold. In recent years, CGS in March quarters has been around 70 percent of Revenue. This is equivalent to a Gross Margin of 30 percent.
Given our Revenue estimate, the typical margin would suggest CGS in the first quarter of 2010 of 0.70 * $2.9 billion = $2.0 billion.
Expenses for Depreciation, Decommissioning, and Amortization have recently been about $360 million per quarter, and we will assume a similar amount for the March quarter.
Since GAAP and Core earnings are expected to be identical, we won't include any provisions for non-recurring operating expenses.
These figures would result in Operating Income of $510 million, down 8 percent from the same quarter of last year.
Edison also reports a plethora of non-operating income and expense items, which we partition into three categories. The first category is Investment gains and losses. The second category is gains on asset sales. The final category is for interest expenses and a plethora of miscellaneous items. We are assuming these figures will be similar to those reported in 2009.
These figures would result in pretax income of $370 million. If we assume an effective tax rate of 31 percent, the tax provision would be $115 million. We also need to subtract values for Minority Interests and Dividends on Preferred Shares. With these adjustments, the estimate for Net Income becomes $235 million (about $0.72 per share). In the year-earlier quarter, Edison earned $250 million ($0.76 per share).
Please click here to see a full-sized, normalized depiction of the projected results next to Edison's quarterly Income Statements for the last couple of years. Please note that our organization of revenues, expenses, gains, and losses, which we use for all analyses, can and often does differ in material respects from company-used formats. The standardization facilitates cross-company comparisons.
Full disclosure: Long EIX at time of writing.


No comments:
Post a Comment